Bitcoin (BTC) Daily Price Forecast – November 27
BTC/USD Medium-term Trend: Bearish
Resistance Levels: $6,800, $6,900, $7,000
Support levels: $3,600, $3,400, $3,200
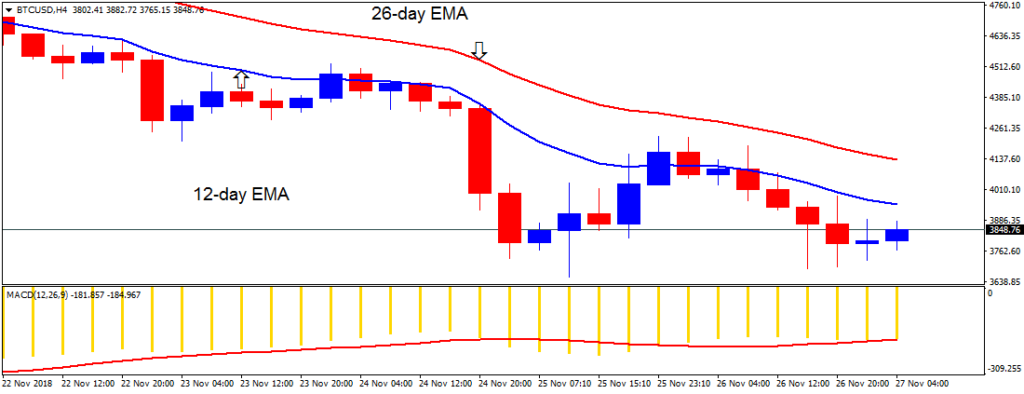
Yesterday, November 26, the price of Bitcoin was in a bearish trend. On November 25, the digital currency fell to the low of $3,774.80 and made a bullish movement to the 12-day EMA. On November 26, the crypto’s price was resisted at the 12-day EMA and it fell to the low of $3835. Price is likely to make another bullish movement to the 12-day EMA.
However, for the digital currency to resume its uptrend the crypto must break the 12-day EMA and the 26-day EMA to the upside and remain above it. Meanwhile, the crypto's price is below the 12-day EMA and the 26-day EMA indicating that price is in the bearish trend zone. Also, the MACD line and the signal line are below the zero line which indicates a sell signal.
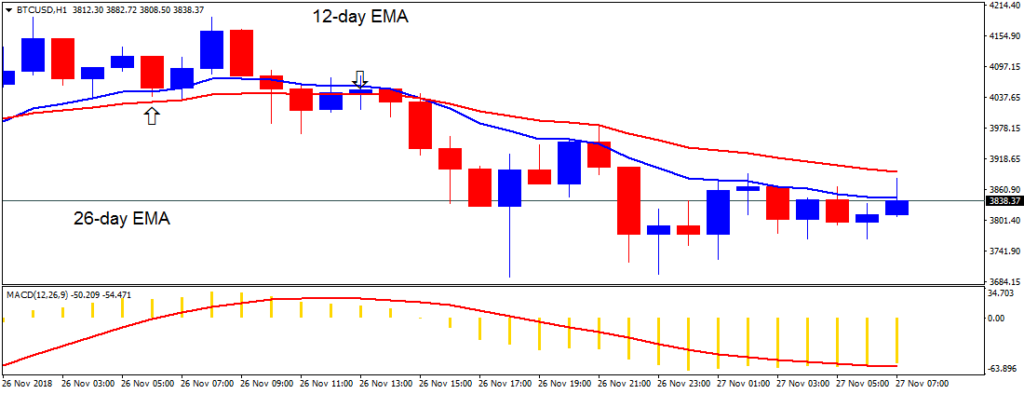
On the 1-hour chart, the price of Bitcoin was in a sideways trend. On November 25, the crypto's price broke the 12-day EMA and the 26-day EMA to the upside and remain above it. On November 26, the crypto ‘s price broke the EMAs to the downside which led to the continuation of the bearish trend.
Courtesy of BitcoinExchangeGuide.com
David Ogden – Http://markethive.com/david-ogden

