Bitcoin (BTC) Price Analysis – Which Direction Can It Break Out?

Bitcoin (BTC) Price Analysis - Which Direction Can It Break Out?

Bitcoin (BTC) Price Analysis – Which Direction Can It Break Out?

Bitcoin is stuck in consolidation for yet another day as it moves back to the triangle bottom.

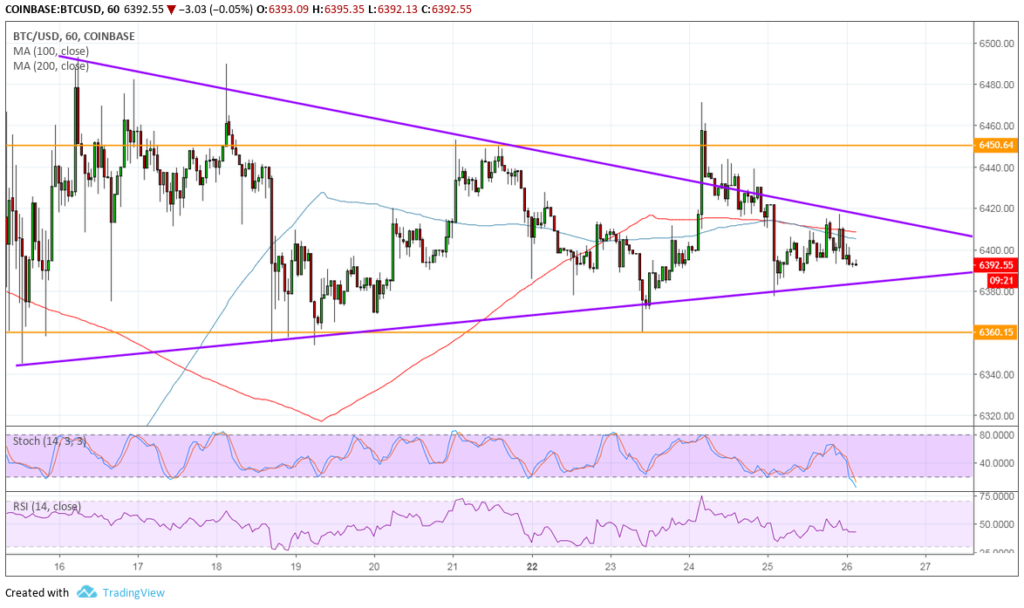
Bitcoin continues to move sideways inside a symmetrical triangle and range visible on the short-term time frames. Price recently bounced off the range resistance and also the top of the triangle, setting its sights back on the bottom.

The 100 SMA is below the longer-term 200 SMA to confirm that the path of least resistance is to the downside. In other words, selling pressure is more likely to persist. In that case, a break of the triangle bottom might be seen, sending price to the range support at $6,360 or onto a slide that’s the same size as the consolidation patterns.

Stochastic is also heading lower to confirm the presence of bearish momentum, but the oscillator is already dipping into the oversold region to signal exhaustion. Turning back up could revive bullish pressure and allow support zones to hold. RSI is starting to turn lower after previously cruising mostly sideways, also reflecting a pickup in selling pressure.

Investors seem wary about the launch of ICE Bakkt futures possibly as early as next month, likely recalling how the CME bitcoin futures launched last year are being blamed for the sharp drop that ensued since then. There is also some degree of wariness associated with the Tether controversy.

Looking ahead, traders could continue to hold out for any major catalysts that could spur and sustain a breakout in either direction. By the way developments are going these days, it appears that there could be further upside, particularly on positive regulatory updates and progress in institutional platforms.

Note that Fidelity will be making its institutional platform for bitcoin and ethereum more widely available as early as Q1 next year so anticipation could build up leading to it. After all, it could usher in strong inflows from banks and hedge funds eager to place bets on the industry.


Rachel Lee by Rachel Lee October 26, 2018

David Ogden – Http://markethive.com/david-ogden

Bitcoin (BTC) Price Watch – Is This a Bullish Breakout Yet?

Bitcoin (BTC) Price Watch -  Is This a Bullish Breakout Yet?

Bitcoin (BTC) Price Watch – Is This a Bullish Breakout Yet?

Bitcoin Price Key Highlights

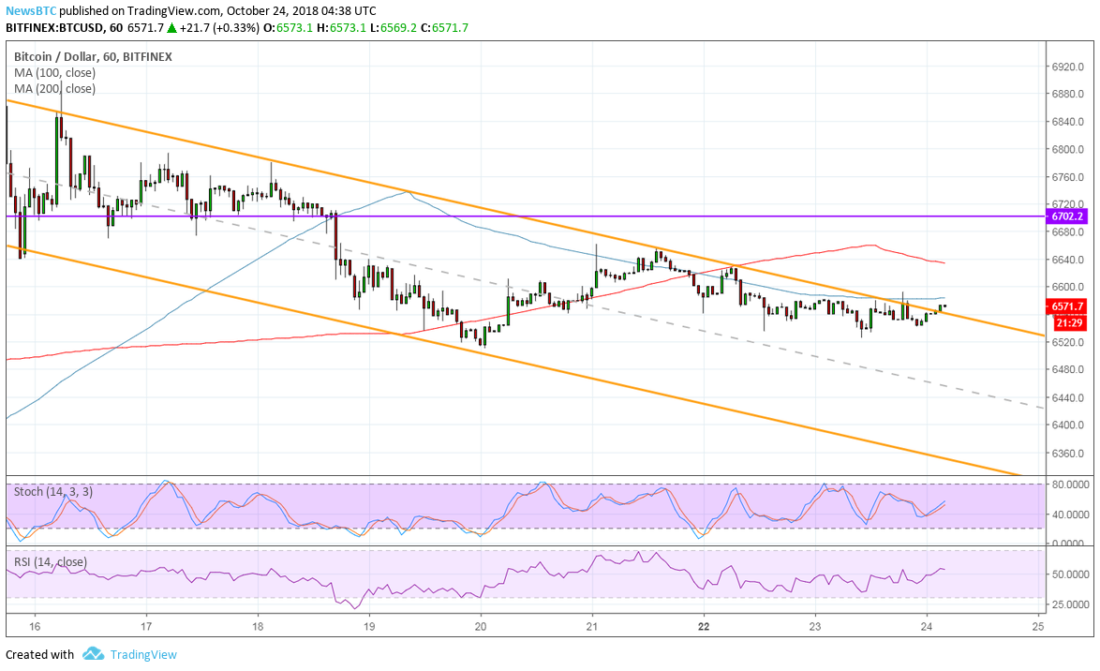
  • Bitcoin price has been trending lower inside a descending channel visible on its 1-hour chart.

  • Price appears to be attempting an upside break as a few hourly candles are closing above the channel top.

  • Technical indicators may be showing some hints of a pickup in bullish momentum.

Bitcoin price is trying to break out of its downtrend but has yet to test nearby resistance levels before sustaining a climb.
 

Technical Indicators Signals

The 100 SMA is below the longer-term 200 SMA to signal that the path of least resistance is to the downside. In other words, the downtrend is still more likely to resume than to reverse. Then again, the gap between the two moving averages is narrowing to signal slowing selling pressure and a potential bullish crossover.

Bitcoin price has yet to break past these dynamic inflection points before confirming a climb, though. And even then it would likely encounter some resistance at the $6,700 mark on its move north.

Stochastic is turning higher without even reaching the oversold area, indicating that buyers are eager to return. RSI is also on the move up and has a lot of ground to cover before reaching the overbought zone. Turning lower from that area could lead to a return in selling pressure, possibly at any of the nearby resistance levels.

Bitcoin price continues to wait for another set of positive catalysts that could allow the earlier surge to resume. For now, it is dealing with risk aversion in financial markets and uncertainty on the SEC decision for bitcoin ETF applications.

Traders might also be taking it easy leading up to the launch of ICE Bakkt bitcoin futures, especially since the ones from CME were blamed for the drop in price late last year. Still, bitcoin has a lot to look forward to in Q1 to Q2 next year on the Fidelity institutional platform.


SARAH JENN | OCTOBER 24, 2018 | 4:52 AM

David Ogden – Http://markethive.com/david-ogden

Wall Street greets bitcoin with interest and worry Bitcoin may be the fraud of the century, depending on whom you believe, or it could be a gold mine for early adopters. Adventurous investors have already bought into the virtual currency and Wall

Wall Street greets bitcoin with interest and worry

Bitcoin may be the fraud of the century, depending on whom you believe, or it could be a gold mine for early adopters.


Adventurous investors have already bought into the virtual currency and Wall Street is laying the groundwork for more wealth to flow into the cryptocurrency.

But nobody can say how big (or small) the bitcoin story will ultimately become.

Bitcoin still cannot be used to buy even a loaf of bread. It cannot be purchased from a company or sold directly on a major financial exchange and it is backed by no central bank. And it also dissimilar to metals like gold or silver, with universally accepted value.

Yet bitcoin is exchanged like money.

Near the end of 2017, bitcoin reached almost $20,000 in value amid a buying frenzy. It has since come down closer to earth and is now worth around $6,400.

Such volatility is too nerve-wracking for most mainstream investors but the radical price swings hold appeal for short-term traders.

rue believers in the currency, along with these short-term speculators, now have a variety of investment opportunities at various risk levels.

Debut on major exchange –

The most direct way to buy bitcoin is on an exchange that specializes in cryptocurrencies, although many of those platforms are at risk of hacking.

In late 2017, the Chicago Board Options Exchange became the first major exchange to offer a bitcoin product, a move that gave a legitimacy to the currency.

The Chicago exchange allowed trading on bitcoin futures — not on bitcoin itself — a financial instrument well known among investment professionals.

Another option is to pick an investment vehicle composed of bitcoin, such as the Bitcoin Investment Trust, which is managed by Grayscale Investments. But those interested in such ventures must transact in a private and bilateral basis and typically pay high fees.

Bitcoin believers are still awaiting the green light from regulators for exchange traded funds(ETF) that would track the movements of the virtual currency, a key step that could take the market more mainstream.

“The arrival of a potential bitcoin ETF remains top-of-mind for institutional investors seeking exposure to this emerging asset class,” said Michael Graham, an analyst specializing in Internet, blockchain and digital assets at Canaccord Genuity.

Each time, the SEC expressed concerns about fraud and manipulation, in part because it is still exchanged primarily on unregulated exchanges.

Broadening acceptance? –

Most of the biggest names in finance are at least studying ways to participate in bitcoin, although the steps so far have been incremental.

Jamie Dimon, chief executive of JPMorgan Chase, the biggest US bank by assets, famously called bitcoin a “fraud” in 2017 and has continued to speak skeptically of it.

Since May, Goldman Sachs has served as a clearinghouse for trading bitcoin futures for clients but has not offered bitcoin investments yet.

But Fidelity Investments, the giant money manager, this month unveiled a new venture, Fidelity Digital Assets, that will execute trades in digital currency for clients and permit them to store bitcoin or other digital assets with Fidelity.

And ICE, the parent company of the New York Stock Exchange, plans to launch its own bitcoin futures contract in November.

Bitcoin platforms continue to have a variety of problems, including lack of transparency, conflicts of interest and weak system safeguards, Christopher Giancarlo, chairman of the US Commodity Futures Trading Commission, said in a mid-October interview on Fox Business.

Yet many pension funds and other mainstream investors are likely to think twice before putting big funds into ventures that could soar — but could also sink.

The US Securities and Exchange Commission has rejected several proposed ETFs, including twice blocking ETFs proposed by the twin Internet entrepreneurs Cameron and Tyler Winklevoss.

“Like all things, it takes time to mature, and with the movement of more institutional investors into the space, I think we’ll see that maturation,” Giancarlo said.


by Juliette MICHEL

New York (AFP) |

David Ogden – Http://markethive.com/david-ogden
Bitcoin (BTC) – Stuck in This Short-Term Range

Bitcoin (BTC) -  Stuck in This Short-Term Range

Bitcoin (BTC) – Stuck in This Short-Term Range

Bitcoin Price Key Highlights


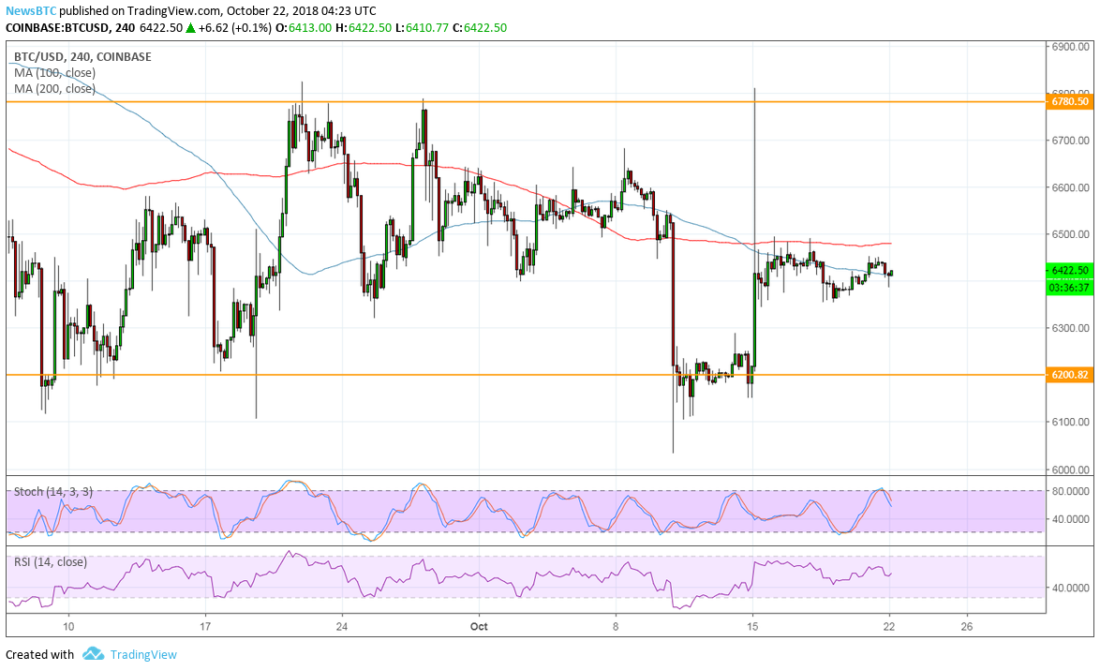
  • Bitcoin price is still treading sideways, right in the middle of its range visible on the 1-hour and 4-hour charts.

  • Price has yet to break out of the current consolidation to show whether it would make a test of support or resistance.

  • Technical indicators seem to be suggesting that a move towards the bottom of the range is due.

Bitcoin price still seems to be waiting for directional clues as it moves sideways in the middle of a $600-sized range.


Technical Indicators Signals


The 100 SMA is below the longer-term 200 SMA to signal that the path of least resistance is to the downside. In other words, a move lower is more likely to happen than a break higher. The moving averages also appear to be holding as dynamic resistance levels as well.

Stochastic is turning lower after recently hitting overbought levels, also suggesting a return in selling pressure. This might be enough to take bitcoin price to the bottom of its range at $6,200. RSI is already on the move down to confirm that sellers have the upper hand.

If buyers are able to step in, a move to the range top at $6,800 could be seen. A break above this could lead to a rally of the same height as the rectangle while a drop below support could lead to a selloff of the same size as well.

There are a handful of positive developments in the bitcoin industry these days, but it looks like traders are waiting for bigger announcements or might be feeling anxious while the SEC continues to mull its decision on the ETFs.

The launch of Fidelity’s institutional platform is big news as this would usher in big flows from funds, banks, and financial institutions. This would boost volumes, activity, and demand, thereby shoring up prices.


SARAH JENN | OCTOBER 22, 2018 | 4:43 AM

David Ogden – Http://markethive.com/david-ogden

Bitcoin – No Weekend Rally in Sight as the Bulls Struggle On


Bitcoin – No Weekend Rally in Sight as the Bulls Struggle On


Bitcoin finds support early to move back through to $6,600 levels, though holding on could be an issue for the bulls if there’s no break out to $6,700.

Bitcoin gained 0.93% on Saturday, partially reversing Friday’s 1.38% fall, to end the day at $6,585.2 and increase Bitcoins gains for the week to 3.93%.

An early morning intraday low $6,511 saw Bitcoin avoid a pullback to $6,400 levels and the day’s first major support level at $6,474.97, with a broad based market rally supporting a move through the day’s first major resistance level at $6,606.27 to a late morning intraday high $6,611 before easing back to $6,500 levels.

A second break through the first major resistance level in the early afternoon saw Bitcoin struggle and fall back to $6,500 levels, with resistance at $6,600 continuing to see Bitcoin fail to break out to take a run at $6,700 levels and bring the 23.6% FIB Retracement Level of $6,757 into play.

For the Bitcoin bulls, it was another close shave, with Bitcoin managing to hold on to positive territory through the day, with the broader market also making up ground through the day, sentiment shifting from the negativity mid-week that saw Bitcoin in the red for 3 consecutive days.

On the news front, there was no material news to influence the crypto majors through the day, with upward momentum across the cryptomarket seeing Bitcoin’s dominance hover at 53.6% and the crypto total market cap rise to $210.8bn.

Get Into Cryptocurrency Trading Today

At the time of writing, Bitcoin was up 0.54% to $6,617.2, with moves through the early part of the day seeing Bitcoin bounce from a start of a day morning low $6,581.2 to a morning high $6,660.8, the start of the day rally seeing Bitcoin break through the first major resistance level at $6,627.13 to come up against the second major resistance level at $6,669.07 before easing back.

For the day ahead, a hold on to $6,600 levels through the morning would support another run through the first major resistance level to bring the second major resistance level at $6,669.07 back into play.

Breaking out from any move through the second major resistance level would need the support of the broader market, with the news wires needing to remain crypto friendly through the day.

Failure to move back through the first major resistance level at $6,627.13 could see Bitcoin hit reverse later in the day, a fall through the morning low $6,581.2 to $6,569 bringing the day’s first major support level at $6,527.13 into play.

Having managed to avoid $6,400 levels since last Monday’s rally, Bitcoin will likely continue to find plenty of support at $6,500 to avoid a more material pullback in the event of a broad based market sell-off, barring materially negative news hitting the wires.

Bob Mason

FXEmpire

30 minutes ago

David Ogden – Http://markethive.com/david-ogden
Bitcoin (BTC) – Are Bears Back in the Game?


Bitcoin (BTC) - Are Bears Back in the Game?

Bitcoin (BTC) – Are Bears Back in the Game?


Bitcoin Price Key Highlights

  • Bitcoin price appears to be turning from the resistance at the top of its descending triangle on the 4-hour chart.

  • Price could be making its way back to the bottom of the triangle again from here.

  • Technical indicators are also reflecting the presence of selling pressure that could keep gains in check.

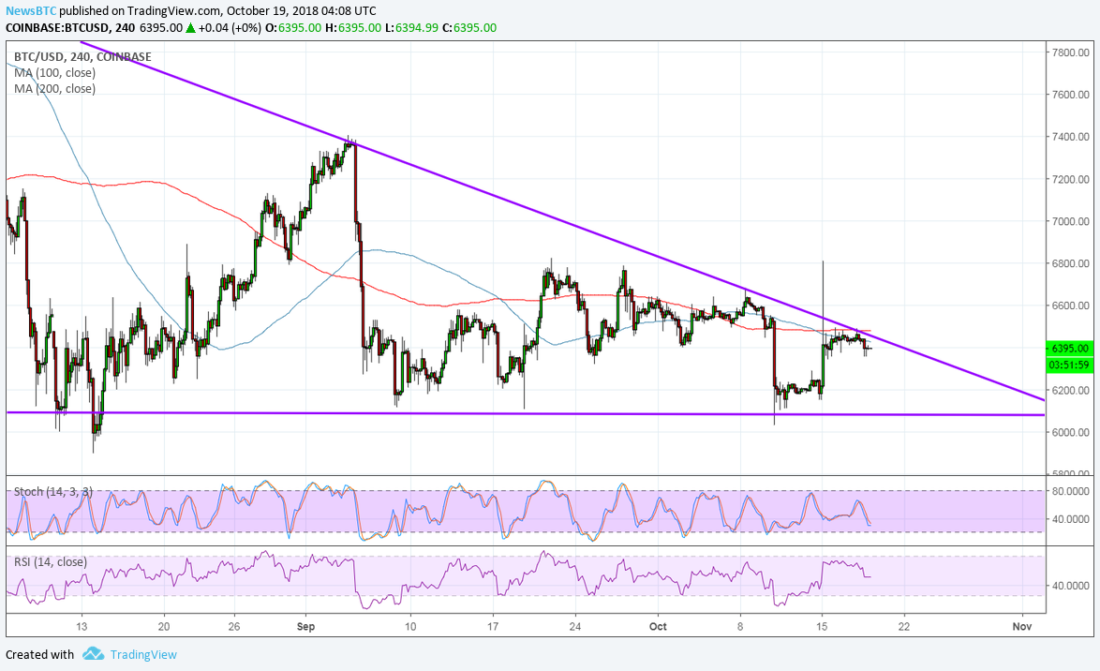
Bitcoin price seems to be having trouble sustaining its earlier climb as the top of the descending triangle is holding as resistance.

Technical Indicators Signals


The 100 SMA is below the longer-term 200 SMA on this time frame, confirming that the path of least resistance is to the downside. In other words, resistance is more likely to hold than to break. These moving averages also coincide with the triangle top to add to its strength as a ceiling.

Stochastic is on the move down so bitcoin price could follow suit while selling pressure is present. This oscillator has some room to go before reaching oversold levels, which means that sellers could stay in control for a bit longer. RSI is also heading south and has plenty of room to cover before reaching oversold territory as well.

The spike higher in bitcoin is seen to be a result of the selloff in Tether as doubts are emerging on its stability and the financial health of Bitfinex. However, traders quickly booked profits as most of the move was also spurred by FOMO or fear of missing out.

Still, there’s enough reason to expect a longer-term rally to materialize as institutional funds could flow in by early next year. Fidelity Investments has unveiled its institutional platform for bitcoin and ethereum, making it available to more hedge funds and financial institutions. Goldman Sachs has also reportedly invested in BitGo in order to make cryptocurrencies more accessible to its clients.

SARAH JENN | OCTOBER 19, 2018 | 4:35 AM

David Ogden – Http://markethive.com/david-ogden
Three dojis mean trouble for Bitcoin


Three dojis mean trouble for Bitcoin

  • BTC/USD sticks to $6,445 amid market indecision.

  • The imminent breakthrough will be forceful and devastating.

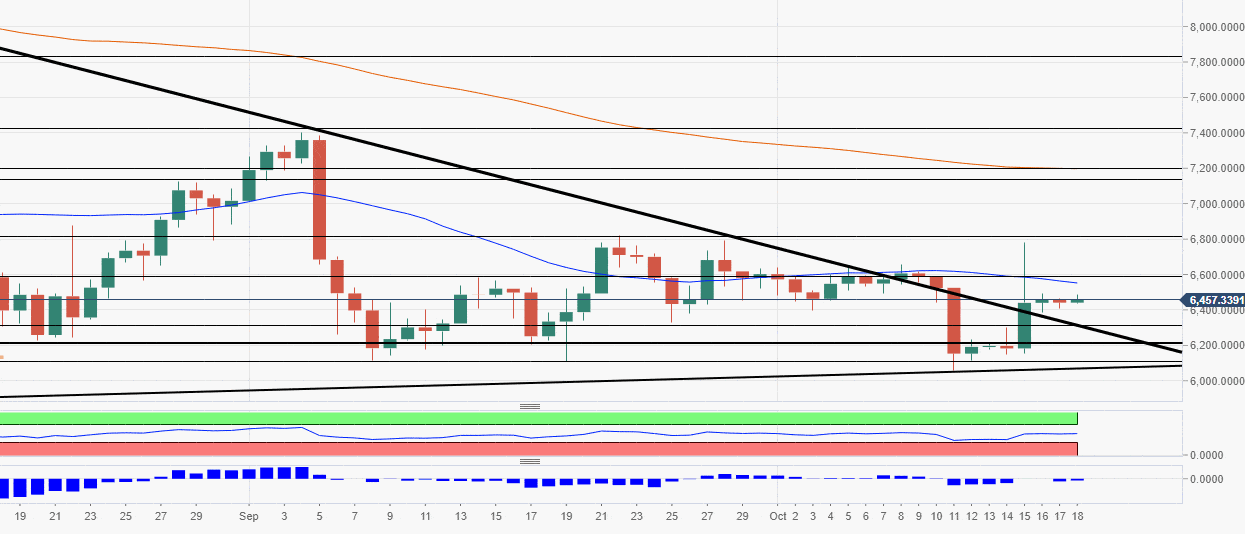
Bitcoin is changing hands at $6,445 at the time of writing. The digital coin No.1 has barely changed since Tuesday, sitting in the tightest range in its recent history. Three doji candlesticks on a daily chart highlight a high level of indecision on the market and promise forceful breakthrough once this coiled spiral starts unwinding.
 

Bitcoin's technical picture

As it is visible on Bitcoin's daily chart, the price has fairly moved since recovering from long-term sloping trendline on Tuesday. While a sustained movement above $6,400 handle looks positive for the bulls, lack of follow through and a prolonged period of consolidation mires short-term perspectives.

Considering the lack of fundamental catalysts it is hard to predict the direction of the breakthrough; however, the bulls' nearest target is $6,600. This resistance limited the recovery since the end of September. Enhanced by DMA50 and 38.2% Fibo retracement monthly, this level can attract new short-term sellers and push the price back inside the current range.

On the downside, bears are focused on $6,400 with a confluence of strong technical levels clustered on approach. They include 61.8% Fibo retracement weekly, 23.6% Fibo retracement monthly, one day low, Pivot Point 1-day Support 1, and a host of SMA levels. Once below, the sell-off will gain traction and take the price to $6,200 and possibly $6.060 (the recent low).

BTC/USD, the daily chart


Tanya Abrosimova

FXStreet

Three dojis mean trouble for Bitcoin

David Ogden – Http://markethive.com/david-ogden

Bitcoin (BTC) Price Watch – Watch This Triangle for Directional Clues

Bitcoin (BTC) Price Watch - Watch This Triangle for Directional Clues

Bitcoin (BTC) Price Watch – Watch This Triangle for Directional Clues

Bitcoin Price Key Highlights


  • Bitcoin price is still stuck in consolidation, forming higher lows and lower highs inside a symmetrical triangle on the short-term chart.

  • Price is approaching the peak of this formation so a breakout might be due soon, providing longer-term directional clues.

  • Technical indicators are giving mixed signals, although there seems to be some bearish pressure in play.

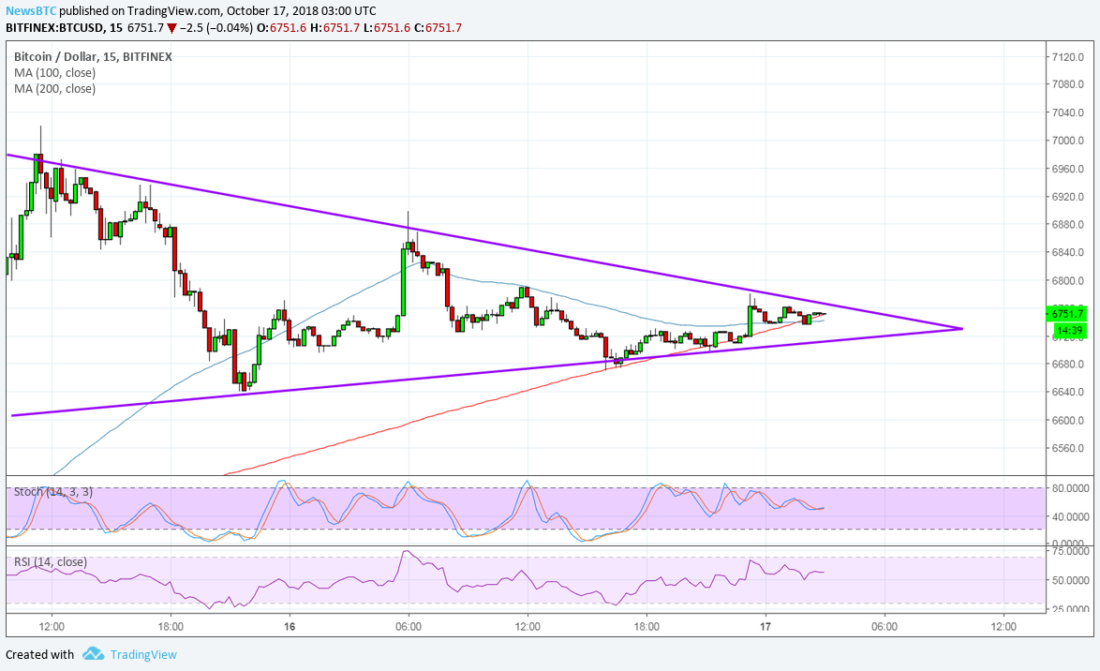
Bitcoin price is consolidating inside a symmetrical triangle on the short-term charts while traders decide which direction to take.


Technical Indicators Signals

The 100 SMA crossed below the longer-term 200 SMA on this time frame, indicating that the path of least resistance is to the downside. In other words, support is more likely to break than to hold, possibly leading to a slide that’s at least the same height as the triangle. This pattern spans $6,640 to around $$7,000.

Stochastic is on the move down to show that sellers are in control and could push for a break below the triangle bottom. RSI also seems to be moving south to signal that bearish pressure could stay in play as the oscillator has plenty of room to move down before hitting oversold levels.

The recent surge in bitcoin price is being pinned on the Tether selloff, although the launch of Fidelity’s institutional platform might be a bigger factor sustaining longer-term gains. After all, this could open bitcoin and ethereum to stronger volumes and increased trading activity from bigger market players.

A candle closing past the $6,750 triangle resistance could be enough to signal an upside break and a continuation of the rally from the larger triangle breakouts. A break below the $6,675 level, on the other hand, could lead to a test of the nearby support zones, although it’s worth noting that bulls are strongly defending the lows by buying on dips.


SARAH JENN | OCTOBER 17, 2018 | 3:54 AM

David Ogden – Http://markethive.com/david-ogden
Is Another Short-Squeeze in Bitcoin Looming?


Is Another Short-Squeeze in Bitcoin Looming?

Following the strong run-up in bitcoin prices yesterday, traders may now be eyeing another opportunity for further growth as the short trade is getting unusually crowded for the number one cryptocurrency.

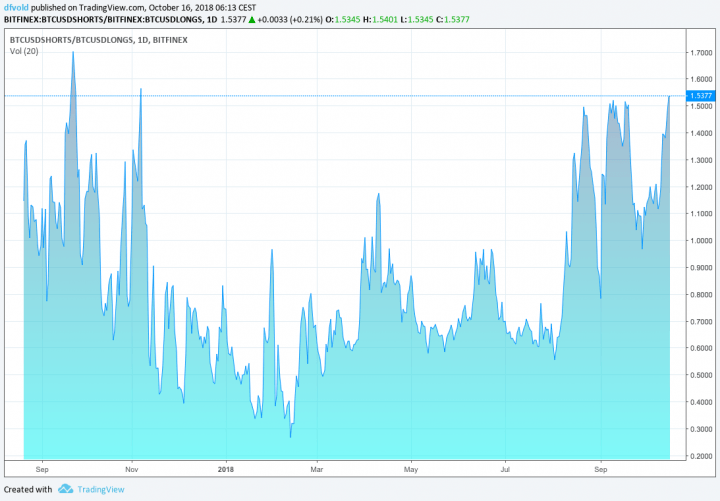
In what appears to be short-term traders positioning themselves for a further sell-off in bitcoin on the Bitfinex exchange, the ratio of short-to-long orders on the exchange reached 1.54 during the Asian trading session Tuesday morning, a level not seen since November last year.

Short-selling essentially involves speculating on lower prices in a market by borrowing an asset that a trader doesn’t currently own in order to sell it in the market. The asset can then be bought back at a lower price later, allowing the short-seller to profit from the difference between the selling price and the buying price.

While a high number of sellers in a market is generally considered a bad sign, it also opens up opportunities when it reaches extreme levels. This is what is known as a short-squeeze, and it is something we have seen repeatedly this year as the short-to-long ratio has hit the high levels we are at now.

If the market starts to move upwards in the near future, many of the short-sellers will exit their short positions by buying back bitcoins in the open market. As the price moves further up, even more short-sellers will get margin calls or hit their pre-set stop-loss levels, forcing them to cover their shorts, and creating a self-reinforcing mechanism that can cause sharp price increases. Whether this will happen again this time, however, still remains unclear.
 

Significant arbitrage opportunities

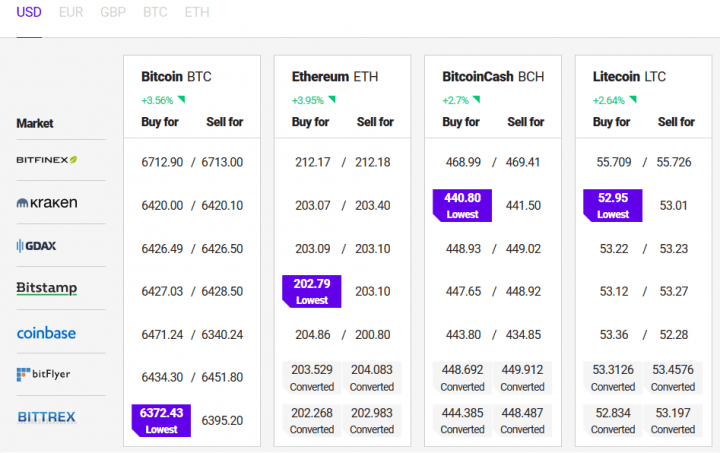
Another possible explanation is that there is a significant amount of arbitrage going on right now centered on the Bitfinex exchange, following the surge in the bitcoin price yesterday that brought the price on Bitfinex to nearly USD 7,800 at its peak. That was close to USD 1,000 higher than on other exchanges like Coinbase, where bitcoin reached a high of about USD 6,800 yesterday.

An obvious way for traders to take advantage of a situation like that is to short-sell bitcoin on Bitfinex, while buying bitcoin on Coinbase or another exchange. That way, a trader would be profiting as the price gap between the exchanges closes.

The bitcoin price was nearly unchanged across exchanges on Tuesday morning, and still remains significantly higher on Bitfinex than on other exchanges, which many in the community attributes to speculation and fear about the status of the popular stable coin Tether.

Price differences at exchanges:

By Fredrik Vold

October 16, 2018

David Ogden – Http://markethive.com/david-ogden
Bitcoin price analysis – Break of $6,000 or breakout to $12,000?

Bitcoin price analysis - Break of $6,000 or breakout to $12,000?

Bitcoin price analysis – Break of $6,000 or breakout to $12,000?

  • BTC nearing a point of breaking out on the long term.

  • Falling wedge suggests, it should be upside breakout.

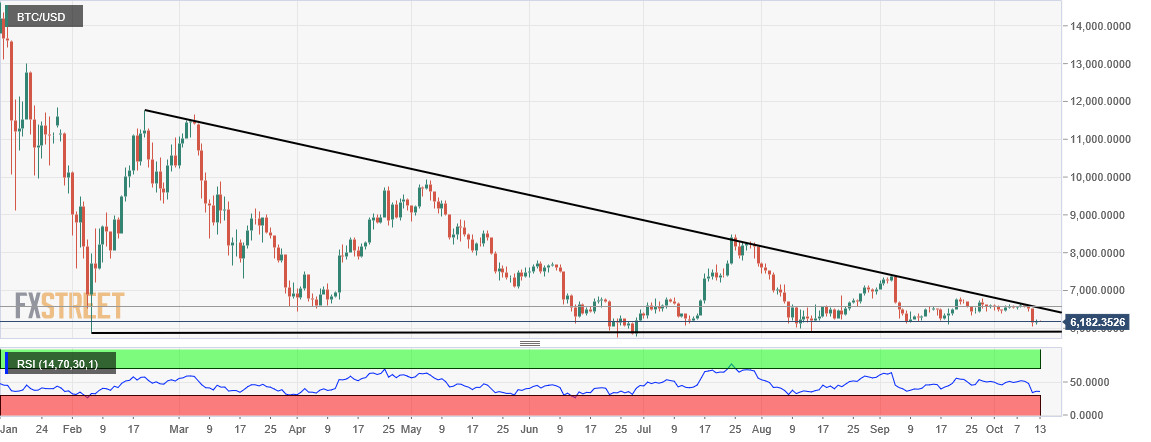
Bitcoin, the largest cryptocurrency by market capitalisation and defacto King of the crypto world, has been trading in a broad range of $6,000-$7,000 for past many weeks and is now reaching a point where it is potentially make or break for the bulls.

BTC/USD is down one cent of a percent at $6,185 in less than one percent range for the day, in a sign of lower weekend volatility. After falling from the upper end of the range, which is also a descending trendline resistance, BTC is now heading towards lower end of it – around $5,900.

This wedge formation, although has failed many times in the past, could be one positive trigger that the bulls were searching for. If bulls manage to bounce from the lower end of this range, then the next move on the upside should result into a breakout with potential targets of beyond $12,000 in the next few months.

BTC/USD daily chart:


Manoj B Rawal

FXStreet


David Ogden – Http://markethive.com/david-ogden