Can the Bitcoin BTC Price Surge 72 to Hit 16000?

Can the Bitcoin (BTC) Price Surge 72% to Hit $16,000?

Last week, crypto investors were making much ado about a Bitcoin prediction that stated that the cryptocurrency would surmount $16,000 in October. As you likely know, this didn’t come true, with the cryptocurrency ending the month at around $9,300 — dozens of percent shy from the $16,000 predicted by the anonymous 4Chan predictor.
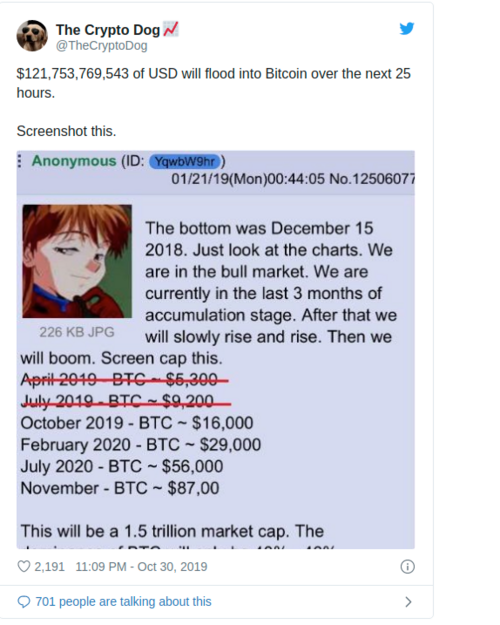
While this was a crushing blow to the Bitcoin optimists, there is still hope that the leading cryptocurrency will soon hit $16,000. That would represent a 72% rally from the current price of $9,200.

A $16,000 Bitcoin?

Changpeng “CZ” Zhao, the much-beloved chief executive of Binance, recently noted that Bitcoin may “see $16,000 soonish.” More specifically, he wrote that:

Lol, price predictions are easy. It’s just hard to be right about the timing. We will see $16k soon-ish. 1.4 billion people working on it as we speak.

The prominent cryptocurrency entrepreneur looked to the fact that China has just embraced blockchain technologies, which many analysts expect to have a positive trickle-down effect on decentralized cryptocurrencies and blockchains like Bitcoin and Ethereum. As one individual put it, blockchain is the gateway drug to BTC.

While CZ may be seen as too optimistic by cryptocurrency investors, there are some analyses that predict that BTC will soon begin to approach that range.

As reported by Ethereum World News, BitcoinGuru said that a massive head fake that Bitcoin just saw clearly satisfies a fractal — when historical price action plays out on current time frames at a different magnitude — that he has been tracking for a while now.

The fractal suggests that the recent drop and subsequent recovery is predicting a massive resurgence, one that will bring Bitcoin higher than its $14,000 year-to-date peak. He wrote that if Bitcoin closes around current levels, he expects for $16,000 to be reached by November 16th.

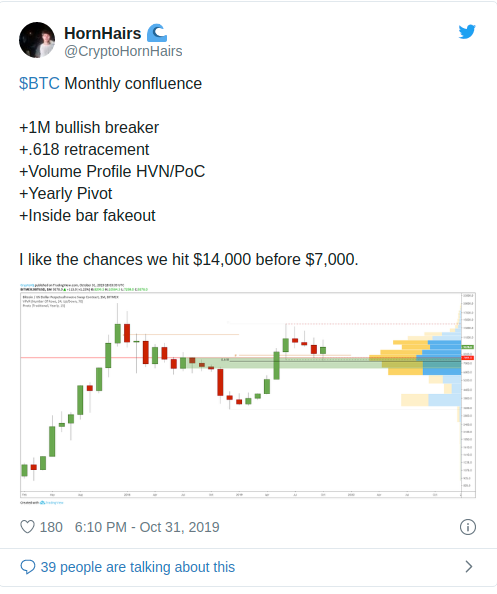
That’s far from the end of it. Trader HornHairs has noted that he “likes the chance we hit $14,000 before $7,000.” He remarked in a recent tweet that with BTC bouncing strong and holding above the one-month bullish breaker, the 0.618 Fibonacci Retracement of the entire cycle, the Point of Control as defined by the volume profile, and the yearly pivot, BTC is leaning rather bullish.
Nick Chong by Nick Chong November 4, 2019in Bitcoin News

David Ogden – Http://markethive.com/david-ogden
Bitcoin BTC Price Weekly Forecast: Signs of Bullish Continuation

Bitcoin (BTC) Price Weekly Forecast: Signs of Bullish Continuation

  • There are positive signs emerging for bitcoin above the $9,200 support against the US Dollar.

  • The price is slowly moving higher and it could retest the $9,770 resistance area in the near term.

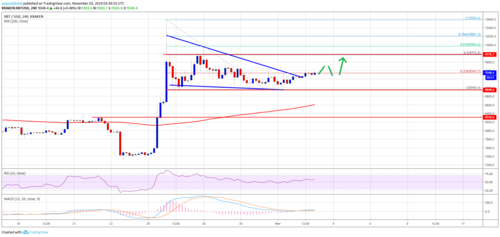
  • There was a break above a key contracting triangle with resistance near $9,240 on the 4-hours chart of the BTC/USD pair (data feed from Kraken).

  • The price remains well supported and it could even surge above $9,800 in the coming days.

Bitcoin price is trading above key supports near $9,000 and $9,200 against the US Dollar. BTC must stay above $8,600 to remain in uptrend and start a fresh increase.


Bitcoin Price Weekly Analysis (BTC)

This past week, there was a slow and steady decline in bitcoin below the $8,400 support against the US Dollar. Moreover, BTC price also traded below the $8,200 support area. Finally, it spiked below the $8,000 support, but remained well above the 100 simple moving average (4-hours).

A swing low was formed near $8,960 and the price recently started an upward move. There was a break above the $8,100 and $8,200 resistance levels to start a decent increase.

More importantly, there was a break above a key contracting triangle with resistance near $9,240 on the 4-hours chart of the BTC/USD pair. At the moment, the price is trading near the 23.6% Fib retracement level of the downward move from the $10,584 high to $8,960 low.

If there are more gains, the price could continue to rise towards the $9,500 and $9,600 resistance levels. Besides, the main resistance is near the $9,770 level. It represents the 50% Fib retracement level of the downward move from the $10,584 high to $8,960 low.

On the downside, there are many supports between $9,200 and $8,960. If there is a bearish break below the $8,960 swing low, there are chances of a sharp decline. The next key support is near $8,600 and the 100 simple moving average (4-hours).

Therefore, the $8,500 and $8,600 support levels are likely to play an important role. As long as the price is above the $8,500 support, there are chances of a fresh increase above the $9,500 level.

Bitcoin Price

Looking at the chart, bitcoin price is clearly showing signs of bullish continuation above $9,500. Having said that, a clear break above the $9,500 and $9,770 resistance levels is needed for uptrend acceleration. In the mentioned case, the price is likely to revisit $10,580.

Technical indicators

4 hours MACD – The MACD for BTC/USD is slowly gaining pace in the bullish zone.

4 hours RSI (Relative Strength Index) – The RSI for BTC/USD is now moving well above the 50 level.

Major Support Level – $8,960

Major Resistance Level – $9,500


Aayush Jindal

David Ogden – Http://markethive.com/david-ogden

Here Is Bitcoin’s Ideal Buying Price According to One Analyst

Here Is Bitcoin’s Ideal Buying Price (According to One Analyst)

On November 1, it was announced that the first regulated Bitcoin fund that has been available in North American exchanges will also be released in Canada.

3iQ Corp, a Canada based company received confirmation from the Ontario Securities Commission (OSC) in order to list ‘The Bitcoin Fund’ on Canada’s stock exchange. This is expected to be done by the end of 2019.

While the news has been positive, the Bitcoin price movement has been confusing, to say the least. The price has been gradually decreasing since October 25’s rapid upward move.

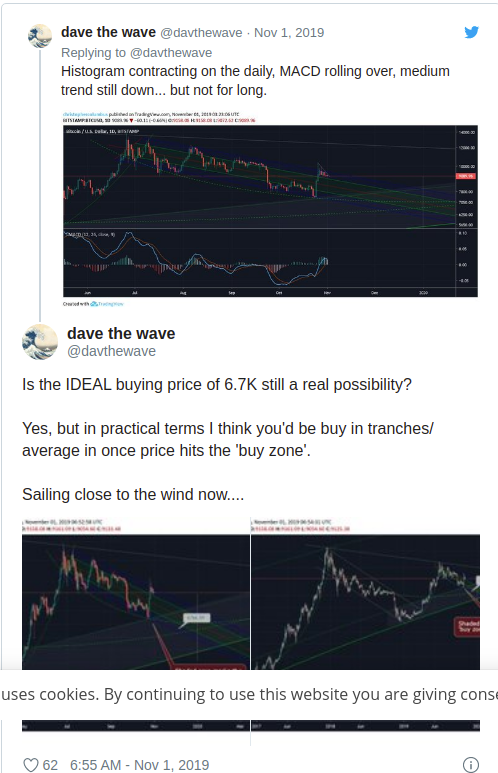
Cryptocurrency trader @davethewave speculated that the ideal buying price for Bitcoin is at $6700. According to our analysis, the ideal buying price may be in the low $7000s or high $6000s.

Additionally, he suggested that averaging in would be ideal — but what does that mean? Let’s analyze both the ideal price and the concept of averaging in.

Pitchfork & Volume

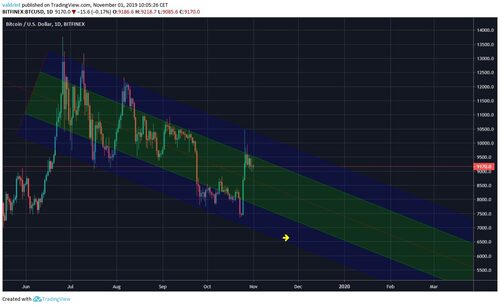
@davthewave used a pitchfork to create a descending channel and determine future price movement.

The ideal buy zone falls within the lower portion of the channel (blue). Since it is descending, the ideal buy price is decreasing as time goes by.


BTC Channel

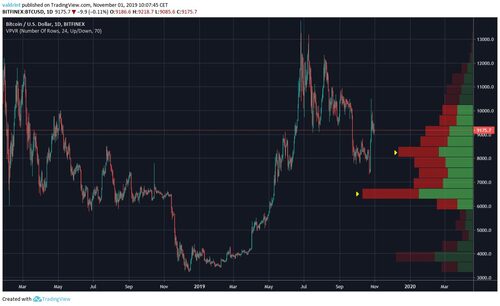
When using the Volume profile indicator, we can see that the strongest buy area is found near $6500 — coinciding well with the buy zone given by the channel.

A decrease below this level could trigger a rapid Bitcoin price decrease.

Long-Term Bitcoin Price Analysis

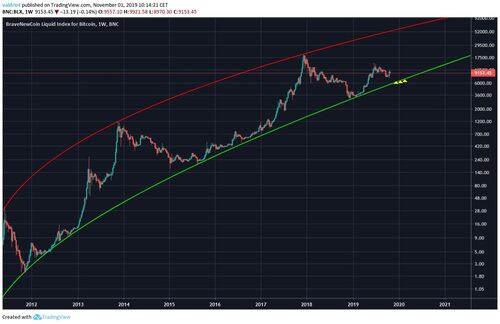
Using a logarithmic chart and curved trendlines, we can see that the support line is currently at $6300 and is slowly moving upward. Therefore, we agree that the ideal buying price may be around $6700.

The concept of averaging-in means placing several orders around an average price. One example of the $6700 price would mean buying with 1/3 of the total amount of your order at $6900, 1/3 at $6700 and 1/3 at $6500.


Valdrin Tahiri 1 min ago

David Ogden – Http://markethive.com/david-ogden

Bitcoin Price to Surge Back to 10000 and Enter a Super Cycle’ Kraken BD Director Says

Bitcoin Price to Surge Back to $10,000 and Enter a ‘Super Cycle', Kraken BD Director Says

Yuri Molchan

The head of business development at Kraken predicts that Bitcoin price is bound to enter a ‘super cycle’, offering a number of reasons

Bitcoin Price to Surge Back to $10,000 and Enter a ‘Super Cycle', Kraken BD Director SaysCover image via www.123rf.com

Bitcoin is heading towards $10,000 a major crypto community member says

Bitcoin is going through another recession, having briefly broken through the $10,000 level and is now back at $9,160 area. Still, the BTC price has risen by a thousand USD, from the $8,200 area.

While some believe that the world’s first crypto is going to keep declining, others, including the Kraken director of Business Development, believe that there are strong reasons for Bitcoin price to surge in the near future.

Dan Hedl: Bitcoin is perfectly positioned for a super cycle

The Kraken executive believes that the BTC price is bound to surge – several prerequisites will trigger it eventually. He mentions the recent QE actions of the US Fed and ECB, the global debt and structural risks of the global financial system that have not disappeared.

In his recent tweet, Dan Hedl says:

Hedl also recently expressed his view of the upcoming Bitcoin Cash halving, saying that this event is likely to greatly reduce the BCH hashrate and increase the risk of 51% attacks against the network.

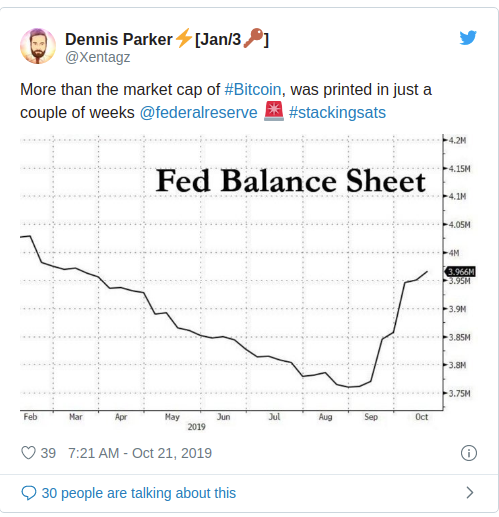
A permabull on Bitcoin, @Xentagz, has also commented on the scale of the recent cash printing actions of the Fed, saying that they have injected in the financial system more than Bitcoin’s market cap.

Happy 11th Birthday, Bitcoin! Satoshi Nakamoto's White Paper Marks New Milestone on Halloween

Bitcoin is heading towards $10,000 a major crypto community member says

On his Twitter page, @MustacheTommy, “crypto warrior” and “Proud supporter of 'Freedom of Money'", says that Bitcoin is heading towards the $10,000 level, rather than towards $6,000 as some in the crypto community believe.

He reckons that the bear market is still on, however, about half a year is left before the Bitcoin price surges to $10,000 and moves higher.

Which 'camp' are you in – do you believe that BTC will keep declining to $6,000 or hit $10,000 soon? Feel free to leave a comment in the section below!

Disclaimer: The opinion expressed here is not investment advice – it is provided for informational purposes only. It does not necessarily reflect the opinion of U.Today. Every investment and all trading involves risk, so you should always perform your own research prior to making decisions. We do not recommend investing money you cannot afford to lose.

Yuri Molchan
 

David Ogden – Http://markethive.com/david-ogden

BTC Bears Are Back Bitcoin Slowly Weakens as Altcoins Beat a Retreat

BTC Bears Are Back, Bitcoin Slowly Weakens as Altcoins Beat a Retreat

Bitcoin has managed to hold on above $9,000 for another day but it is slowly weakening and likely to drop below that support level by the weekend. The altcoins meanwhile are already sliding further and may well dump all recent gains.

Bitcoin Support Weakening

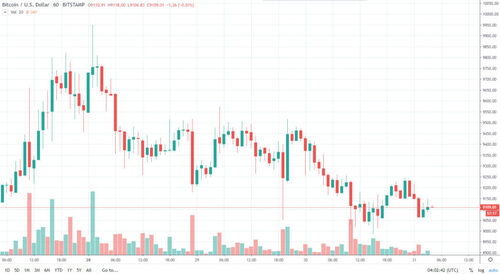
The pattern is pretty clear when looking at the Tradingview charts. A down trend has formed on the week and Bitcoin is slowly losing ground as it slides back towards $9k this Halloween day. The highest it could manage over the past day is $9,250 and a couple of hours ago BTC dropped to its intraday low of $9,050 for the second time.

BTC price 1 hour – Tradingview.com

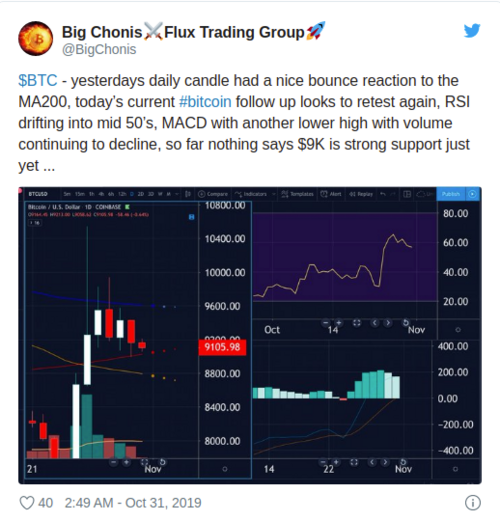
Lower highs and lower lows indicate a continuation of this trend in the short term. Trader and analyst ‘Big Chonis’ has been doing the TA …

“Yesterday’s daily candle had a nice bounce reaction to the MA200, today’s current bitcoin follow up looks to retest again, RSI drifting into mid 50’s, MACD with another lower high with volume continuing to decline, so far nothing says $9K is strong support just yet …”

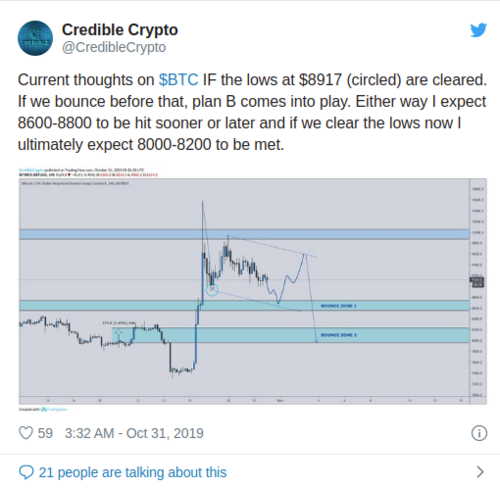
The bearish sentiment is starting to return to crypto twitter as analysts start to agree that down is more likely than up. ‘Credible Crypto’ added that a fall back to the low $8,000 level is likely.

“Either way I expect 8600-8800 to be hit sooner or later and if we clear the lows now I ultimately expect 8000-8200 to be met.”

China fever is waning and it is back to business on Bitcoin markets which were heading downwards before the huge weekend boost.

Altcoins in Pain Again

Ethereum has declined by 2.5% over the past 24 hours as it drops back to $185. ETH really needs to keep hold of these gains to prevent an eventual collapse to $150. There has been no indication that it is ready to break free from the shadows of its big brother though.

XRP just can’t break over $0.30 and has fallen back below it again today as the Ripple token loses 2%. Bitcoin Cash has also dropped 2% but it has been very bullish over the past week holding on to most of its gains. BCH is currently trading just below $290 but is primed to fall if BTC does.

Litecoin and Binance Coin are flat, hovering around $60 and $20 respectively while EOS is dumping again in another 3% fall. Following its Samsung induced pump yesterday, Tron is dumping today as a 7% slide drops TRX back to $0.020.

Around $5 billion has exited crypto markets over the past 24 hours as total capitalization falls to $245 billion. Markets are still up $40 billion on the same time last week but the bears are slowly returning and those gains are starting to erode.


Martin Young

David Ogden – Http://markethive.com/david-ogden

After the recent surge in price by BTC other crypto currencies are making positive moves after attaining a bullish break Binance Coin NEO Bitcoin SV are making positive moves except for Stellar and IOTA

After the recent surge in price by BTC, other crypto currencies are making positive moves after attaining a bullish break. Binance Coin, NEO, Bitcoin SV are making positive moves except for Stellar and IOTA.

The selling pressures are being exhausted as the bulls take control of the price. The bullish market can equally be sustained if buyers are introduced at the demand zones.

BNB/USD Major trend: Bullish

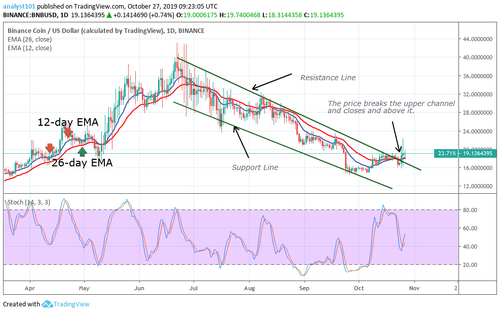
On October 24, the BNB price finally broke the resistance line of the descending channel which indicates a positive sign. This may signal the end of the downtrend if the bulls sustain the price above the channel. The market is above the 40% range of the daily stochastic indicator which means that price is in a bullish momentum. Nevertheless, from the price action, if the bulls break above the previous highs of $20 and $24 price levels, the pair will be out of the downtrend zone.

NEO/USD Major trend: Bullish

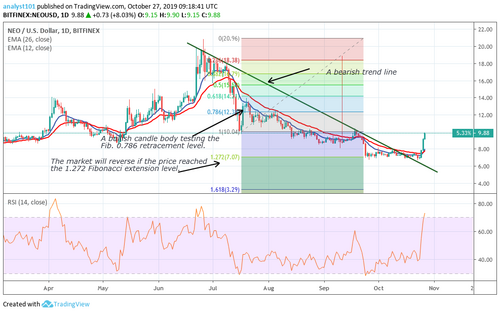
The NEO/USD pair has made a more positive move than Binance Coin as the bulls took control of price. The coin will be out of the downtrend zone if it overcomes the resistance levels of $10 and $ 12. The market is approaching the overbought region of the Relative Strength Index period 14 level70. In other words, the market is in the bullish trend zone. The Fibonacci tool confirms that the market will reverse at the 1.272 extension level because a bullish candle body tested the 0.786 retracement level.

XLM/USD Major trend: Ranging

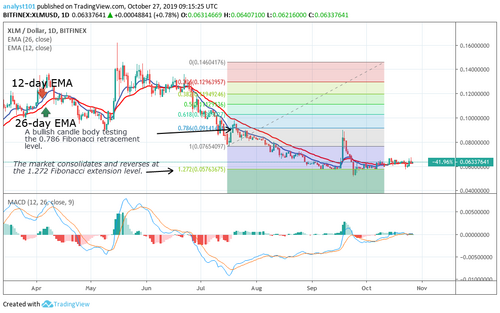
In October, Stellar has been consolidating above the $0.060 support level after the last bearish impulse. The bulls and the bears are undecided about the direction of the market for the past month. The 12-day and 26-day EMAs are trending horizontally indicating that price is in a sideways movement. According to the Fibonacci tool, Stellar may as well reverse at the 1.272 extension level.

BSV/USD Major trend: Bullish

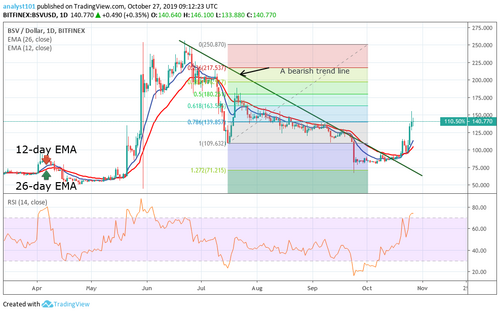
Bitcoin SV is making another positive move as the price breaks the bearish trend line and reaches the previous highs. Presently, it is facing resistance at the $150 price level. The coin is in the bullish trend zone. Nevertheless, if the price continues its upward move, and the $150 and $175 resistance levels are broken, the coin will attain a previous high of $250 supply zone. The market is trading in the overbought region of the Relative Strength Index period 14 levels 69.

IOTA/USD Major trend: Ranging

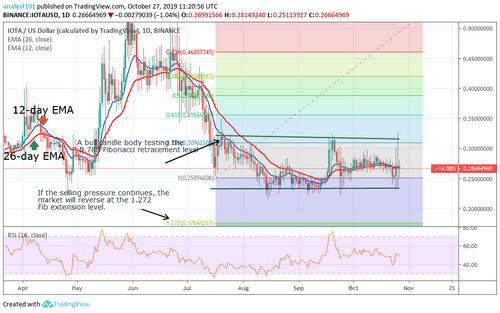
In October, the IOTA/USD pair has been consolidating in a tight range. The market fluctuates between the levels of $0.25 and $0.28. This consolidation in a tight range was as a result of the failure of the bulls to break the $0.30 resistance level. Likewise, the bears were unable to break below the $0.25 support level. Meanwhile, the Fibonacci tool indicates that IOTA is likely to fall to the 1.272 extension level. The Relative Strength Index period 14 level 47 explains that IOTA is in a sideways move.


Oct 28, 2019 at 09:41 // NEWSAuthor

Coin Ido

David Ogden – Http://markethive.com/david-ogden

Bitcoin BTC Price Consolidating Gains Bulls Eyeing Fresh Increase

Bitcoin (BTC) Price Consolidating Gains, Bulls Eyeing Fresh Increase

  • Bitcoin price is currently consolidating above the key $9,000 support area against the US Dollar.

  • The price is struggling to gain bullish momentum above the $9,600 and $9,720 resistance levels.

  • There is a connecting bearish trend line forming with resistance near $9,560 on the hourly chart of the BTC/USD pair (data feed from Kraken).

  • The price must climb above $9,600 and gain pace above $9,720 to continue higher in the near term.

Bitcoin price is likely setting up for the next major break against the US Dollar. BTC remains well supported above $9,000 and it could climb higher towards $10,000.

Bitcoin Price Analysis

Recently, bitcoin price climbed towards the $10,000 resistance area against the US Dollar. However, BTC failed to continue higher and formed a high near the $9,935 level.

Later, there was a fresh decline below the $9,600 and $9,500 support levels. The price traded close to the $9,100 support area and remained well bid above the 100 hourly simple moving average. The recent low was near $9,194 and the price is currently climbing steadily.

There was a break above the 23.6% Fib retracement level of the recent decline from the $9,935 high to $9,194 swing low. At the outset, bitcoin is testing the $9,500 and $9,550 resistance levels. Additionally, there is a connecting bearish trend line forming with resistance near $9,560 on the hourly chart of the BTC/USD pair.

More importantly, the 50% Fib retracement level of the recent decline from the $9,935 high to $9,194 swing low is acting as a hurdle for the bulls. Therefore, an upside break above the $9,550 and $9,600 levels is needed for a fresh increase.

The next major resistance is near the $9,720 level, above which the price could rise steadily towards the $10,000 resistance area. If the price accelerates above $10,000, it could revisit the $10,500 zone.

Conversely, if the price fails to break the $9,550 and $9,600 resistance levels, there could be another downward move. An immediate support is near the $9,200 area. Having said that, the main support is near the $9,000 level and the 100 hourly SMA.

Looking at the chart, bitcoin seems to be consolidating nicely above the $9,000 and $9,200 levels. As long as there is no close below the 100 hourly SMA, there are chances of a fresh increase towards the $10,000 and $10,200 levels in the coming sessions.

Technical indicators:

Hourly MACD – The MACD is showing positive signs in the bullish zone

Hourly RSI (Relative Strength Index) – The RSI for BTC/USD is moving higher and it is currently near the 50 level.

Major Support Levels – $9,200 followed by $9,000.

Major Resistance Levels – $9,550, $9,600 and $9,720.


Aayush Jindal

David Ogden – Http://markethive.com/david-ogden

Bitcoin BTC Price Steadies Uptrend But Another Correction Likely

Bitcoin (BTC) Price Steadies Uptrend But Another Correction Likely

  • Bitcoin price is gaining bullish momentum and is trading above $9,500 against the US Dollar.

  • The price is facing a strong resistance on the upside near the $9,820 and $9,850 levels.

  • There is a crucial bullish trend line forming with support near $9,500 on the hourly chart of the BTC/USD pair (data feed from Kraken).

  • The price could correct in the short term towards $9,200 before another rally.

Bitcoin price is trading in a steady uptrend above $9,000 and $9,200 against the US Dollar. BTC is likely to climb steadily with a few downward moves.

Bitcoin Price Analysis

This past week, there was a sharp rally in bitcoin above the $7,500 and $8,000 resistances against the US Dollar. BTC even surged above the $9,500 and $10,000 levels before correcting lower.

Later, the price corrected below the $9,500 support and the $9,000 pivot zone. However, the decline was contained below $9,000 and the price remained well above the 100 hourly simple moving average.

A low was formed near $8,896 and bitcoin started a fresh increase. It broke the $9,000 and $9,200 resistance levels. Moreover, there was a break above the 50% Fib retracement level of the downward correction from the $10,578 high to $8,896 low.

However, the price seems to be facing a strong resistance near $9,850 and $9,900. Besides, the 61.8% Fib retracement level of the downward correction from the $10,578 high to $8,896 low prevented any further upsides.

At the moment, the price is declining and is moving towards the $9,500 support. More importantly, there is a crucial bullish trend line forming with support near $9,500 on the hourly chart of the BTC/USD pair.

If there is a downside break below the trend line, the price could extend its downward correction towards the $9,200 level. Any further losses may perhaps push bitcoin price towards the $8,750 support area.

Conversely, if the price continues to climb higher, it could climb above the $9,850 and $9,900 resistance. The main hurdle is near the $10,000 level, above which the price is likely to climb towards $10,500.

Bitcoin price

Looking at the chart, bitcoin is showing a lot of positive signs above the $9,500 and $9,200 levels. However, there are a few chances of anther downward move towards $9,200 or $9,000 to complete the correction. Once the price completes the current correction, it is likely to surge above $10,000 or even $10,500.

Technical indicators:

Hourly MACD – The MACD is slowly moving into the bearish zone.

Hourly RSI (Relative Strength Index) – The RSI for BTC/USD is correcting lower and it might test the 50 level.

Major Support Levels – $9,500 followed by $9,200.

Major Resistance Levels – $9,850, $9,900 and $10,000.


Aayush Jindal

David Ogden – Http://markethive.com/david-ogden

Bitcoin BTC Price Weekly Forecast – Is This Real Bullish Break?

Bitcoin (BTC) Price Weekly Forecast – Is This Real Bullish Break?

  • There was a strong rise in bitcoin price from above $8,000 and $9,000 against the US Dollar.

  • The price even spiked above the $10,000 resistance, but it failed to hold gains and declined.

  • There is a short term bullish trend line forming with support near $9,080 on the 4-hours chart of the BTC/USD pair (data feed from Kraken).

  • The price could bounce back as long as it is trading above the $8,600 and $8,500 support levels.

Bitcoin price is trimming gains after a sharp rally against the US Dollar. BTC must stay above $8,500 to start a fresh increase. If not, it could dive back to $8,000.

Bitcoin Price Weekly Analysis (BTC)

In the past two days, there were heavy swing moves in BTC from the $7,500 support against the US Dollar. The BTC/USD pair rallied more than 20% and broke many hurdles near $8,500 and $9,000.

Moreover, there was a close above the $8,500 resistance area and the 100 simple moving average (4-hours). Finally, the price rallied above the $10,000 resistance and traded close to the $10,600 resistance area.

However, the bulls failed to remain in control and a top was formed near $10,591. Later, there was a strong downside correction below the $10,000 level. The price traded below the 23.6% Fib retracement level of the rally from the $7,425 swing low to $10,591 high.

Besides, the price traded below $9,500 and tested the $9,000 support area. Besides, it seems like the 50% Fib retracement level of the rally from the $7,425 swing low to $10,591 high is currently acting as a strong support.

More importantly, there is a short term bullish trend line forming with support near $9,080 on the 4-hours chart of the BTC/USD pair. If there is a downside break below the trend line and $9,000, bitcoin price could test the next major support near the $8,600 area.

The $8,600 and $8,500 levels are crucial supports since they acted as hurdles previously. Additionally, the 61.8% Fib retracement level of the rally from the $7,425 swing low to $10,591 high might also provide support.

Therefore, the $8,500 support is likely to act as a major support. If the price fails to stay above $8,500, it could move back into a downtrend.

Looking at the chart, bitcoin price is clearly trimming gains and approaching a few key supports near $9,000 and $8,600. If it fails to stay above $8,500, the recent rally could completely reverse in the coming days.
 

Technical indicators

4 hours MACD – The MACD for BTC/USD is slowly moving in the bearish zone.

4 hours RSI (Relative Strength Index) – The RSI for BTC/USD is moving lower and is close to the 50 level.

Major Support Level – $8,500

Major Resistance Level – $9,500


Aayush Jindal

David Ogden – Http://markethive.com/david-ogden

Bitcoin Price Tapped 10600 in Fourth Largest Bull Move Ever

Bitcoin Price Tapped $10,600 in Fourth Largest Bull Move Ever

For now, Bitcoin (BTC) bulls seem to have decimated the bears. As of the time of writing this article, the leading cryptocurrency is at $9,800 — up over $2,500, some 38%, in the past 36 hours. This is around $800 short of the daily high of $10,600.

This rally has gotten so out of hand that BitMEXRekt, a Twitter bot dedicated to updating Crypto Twitter to liquidations on its namesake platform, has crashed.

Related Reading: Bitcoin Price Rips Past $9,000, Now Up 20% On the Day

Bitcoin Up 40% on the Day

According to Alex Kruger, Bitcoin, as the time of his tweet, was up 42% on the day. This purportedly represents the asset’s fourth-largest gain in its history, and the largest since May 10th, 2011.


Alex Krüger

So, what caused this move?

The seeming catalysts vary from analyst to analyst.

But according to Gabor Gurbacs, who summarized the narratives well, there are three reasons why Bitcoin surged: 1) the latest CME’s Bitcoin futures contract expired, something that has traditionally led to volatility, often in the upward direction; 2) President Xi Jinping of China revealed that he supports the development and adoption of blockchain technologies in China; and lastly 3) the chief executive of Crypto Capital, a firm offering financial services to industry companies including Bitfinex, was arrested, which Gurbarcs claims will allow clients of the firm to “get some of [their] seized [money] back.”

Slight Reversal Possible

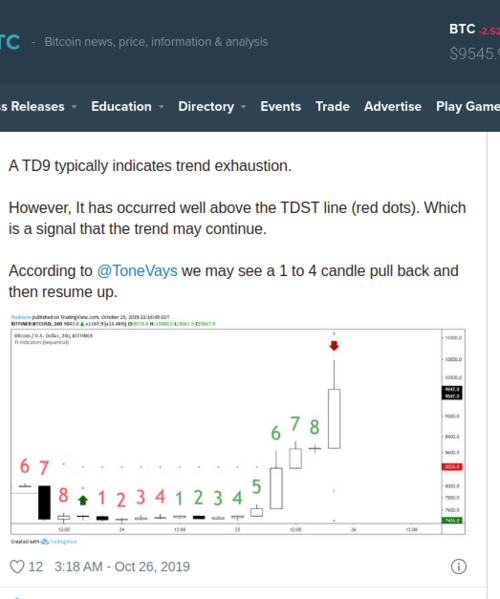
While this is move is undeniably bullish, some are starting to expect a pullback. Popular analyst Nunya Bizniz pointed out that Bitcoin’s latest four-hour candle, which reached as high as $10,600 on BitMEX, is a “perfected Tom Demark Sequential 9.”

Bizniz notes that “a TD 9 typically indicates trend exhaustion,” implying that there may be some stagnation or a healthy pullback before a resumption of the uptrend.

Indeed. He added that according to Tone Vays’ take on the indicator, “we may see a one to four candle pullback (four to 16 hours) and then resume up.”


Nick Chong

David Ogden – Http://markethive.com/david-ogden