Bitcoin (BTC) Price Analysis – Ready To Breach Next Area Of Interest

Bitcoin (BTC) Price Analysis – Ready To Breach Next Area Of Interest?

Bitcoin is heading further north and is approaching the next major area of interest.

BITCOIN PRICE ANALYSIS


Bitcoin appears to be starting a climb on its short-term time frames but has yet to break past this major area of interest to sustain the uptrend. On the 4-hour chart, technical indicators are suggesting that there’s a chance for the downtrend to resume.


For one, the 100 SMA is safely below the longer-term 200 SMA to signal that the path of least resistance is to the downside. This means that the selloff is more likely to carry on than to reverse.


Stochastic is turning lower after hitting overbought levels, which means that selling pressure is returning while buyers take a break. Similarly RSI is heading south so bitcoin could follow suit and revisit the swing low around $5,750.


Price has broken past the 100 SMA near-term dynamic resistance to show a bit of bullish momentum but has yet to contend with the 200 SMA dynamic inflection point. This lines up with the 50% Fibonacci retracement level around $6,750. A break higher could still hit a ceiling at the 61.8% level near the $7,000 major psychological resistance.
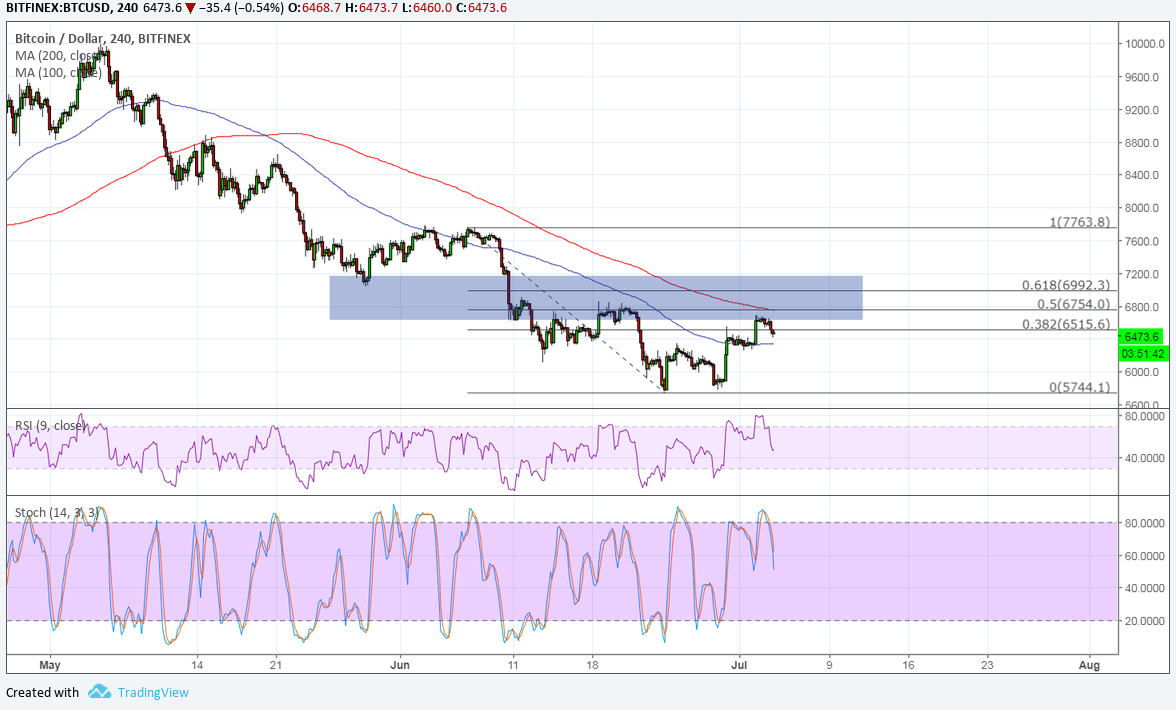


A break past these levels could finally signal that bulls have won over and reflect a longer-term reversal from the drop that lasted roughly a couple of months. On the other hand, if any of the nearby resistance levels keep gains in check, bitcoin might even break below the swing low later on.


So far, though, cryptocurrencies have been reestablishing a more solid footing at the start of this quarter. Some attribute it to investor optimism which is usually observed during the start of new months while others say that this is merely a dead cat bounce.


Another factor that may be propping up bitcoin and its peers is the ongoing trade war, as escalation could bring more losses to stocks and commodities. Investors seeking higher returns on riskier holdings could choose to put their funds in digital assets instead.


By Rachel Lee On Jul 4, 2018

David Ogden – Http://markethive.com/david-ogden
Bitcoin (BTC) Price Watch – Are Bears Back in the Game?

Bitcoin (BTC) Price Watch - Are Bears Back in the Game?

Bitcoin (BTC) Price Watch – Are Bears Back in the Game?

Bitcoin Price Key Highlights


  • Bitcoin price broke below the latest swing low to confirm that selling pressure remains.

  • Price is testing one of the Fibonacci extension levels and could head to the next ones from here.

  • Technical indicators are giving mixed signals but the overall downtrend remains intact.

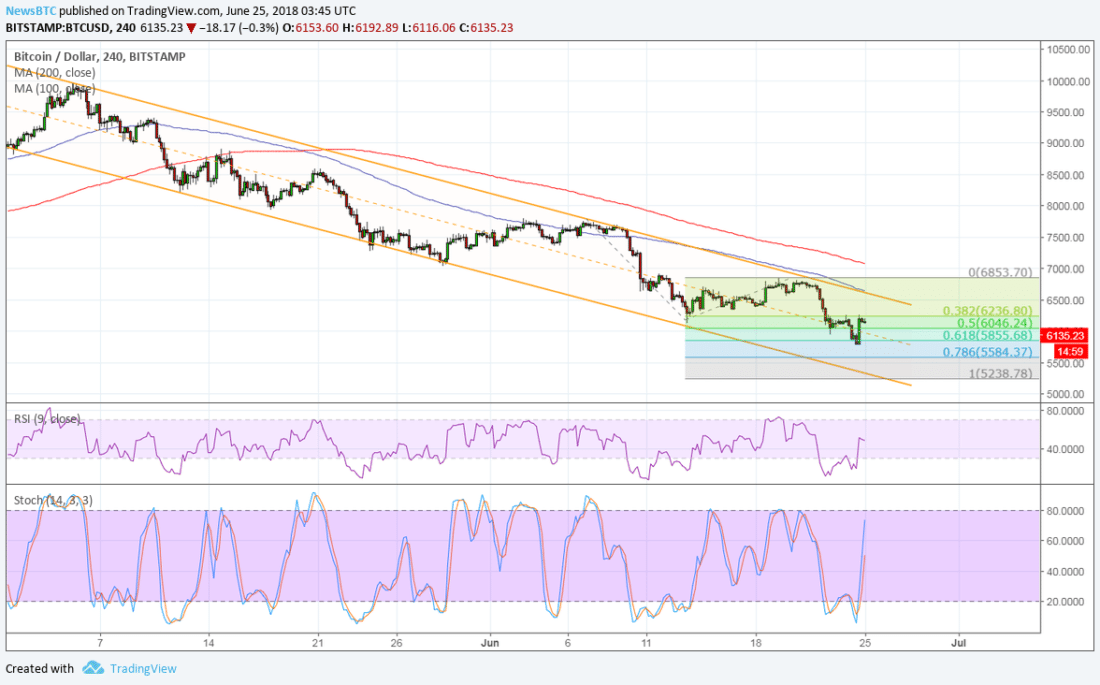
Bitcoin price is resuming the slide and bearish pressure could pick up now that it broke below the $6,050 swing low.
 

Technical Indicators Signals


The 100 SMA is safely below the longer-term 200 SMA to signal that the path of least resistance is to the downside. This signals that the selloff is more likely to resume than to reverse. The short-term moving average also lines up with the top of the channel to add to its strength as a ceiling.


Price has broken below the swing low and 50% Fib extension around $6,050 to indicate that bearish momentum is picking up. This might be enough to take bitcoin down to the support at $5,500 or the full extension at $5,238.
 

However, RSI is heading north so bitcoin price could follow suit. Similarly stochastic is moving up to indicate that buyers are trying to regain control while sellers take a break. Once both oscillators hit overbought levels, though, bears could return and push for new lows.

Market Factors


Bitcoin price suffered another tumble on news of yet another hack, this time in China involving cryptocurrency called Siacoin. As it turned out, malware affecting computers in some internet cafes allowed hackers to mine Siacoin worth approximately $800,000.

Although this amount is relatively small and does not directly affect bitcoin price, the impact on industry confidence has been significant. In previous weeks, there have been hacks on South

Korean exchange Coinrail and on larger company Bithumb, so it’s no surprise that investors are on edge when it comes to security issues.


SARAH JENN | JUNE 25, 2018 | 4:07 AM

David Ogden – Http://markethive.com/david-ogden
Bitcoin Price Technical Analysis 23 April – Bulls Back in Action

Bitcoin Price Technical Analysis 23 April – Bulls Back in Action

Bitcoin Price Key Highlights

  • Bitcoin price has gained some traction since breaking past its inverse head and shoulders neckline.

  • Price is now trading inside an ascending channel and testing the resistance.

  • A return in bearish pressure could take it back down to support around the Fib levels.

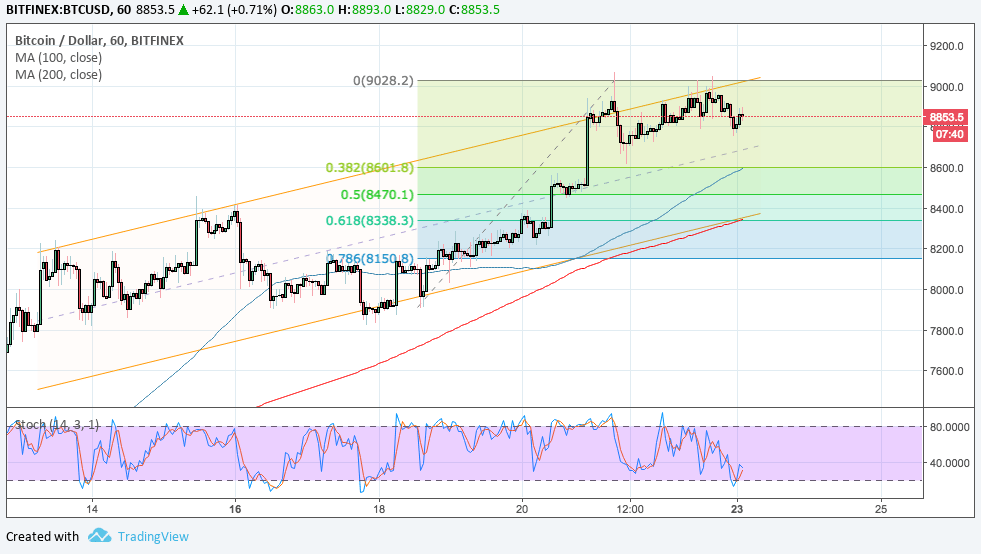
Bitcoin price is trending higher but might be due for a pullback to its channel support.


Technical Indicators Signals

The 100 SMA is above the longer-term 200 SMA to signal that the path of least resistance is to the upside. This indicates that the uptrend is more likely to resume than to reverse.

Applying the Fib tool to the latest swing low and high shows that the 61.8% retracement level lines up with the bottom of the channel at $8338.30. The 38.2% retracement level is close to the mid-channel area of interest at $8600.

The 100 SMA is above the longer-term 200 SMA to confirm that the path of least resistance is to the upside. In other words, the uptrend is more likely to continue than to reverse. The gap between the two is also widening to reflect stronger bullish momentum.

Stochastic looks ready to turn up from the overbought zone to signal a return in buying pressure. In that case, bitcoin could even attempt to break past the channel resistance or swing high at $9000 to establish a steeper climb.


Market Factors

Exchanges are reporting that buy orders are nearing 92% of activity, drawing even more investors in so as to not get left behind in the rally. Some predict that bitcoin could surge past the $20,000 highs within the quarter.

Risk appetite has also been mostly supported in the markets, which means that traders are willing to place bets outside of traditional assets like stocks and commodities. Sentiment in the cryptocurrency industry itself has also improved significantly over the past couple of weeks, spurred by news about big hedge funds and acquisitions in the space.


Author SARAH JENN | APRIL 23, 2018 | 5:37 AM


Posted by David Ogden Entrepreneur

David Ogden – Http://markethive.com/david-ogden
What is the price of bitcoin today – Why is BTC rising

What is the price of bitcoin today - Why is BTC rising

What is the price of bitcoin today? Why is BTC rising?

BITCOIN prices are back on the rise today, as the cryptocurrency posts strong results mid week. What is the price of bitcoin today? Why is BTC rising?

Midweek charts show bitcoin prices are back on the rise.

The cryptocurrency has been steadily rising overnight, increasing by more than 2.44 percent in the last hour.

Bitcoin prices were trading at $8,239.66 as of 4.30pm today.

The rest of the cryptocurrency market has also seen a bumper rise in prices.

Ethereum stays ahead of resistance at $544 and Ripple increased 6.83 percent to trade at $0.728 percent.

Bitcoin spin-off, Bitcoin Cash, rose by 13.11 percent to hover just below £1,000 a coin at $940.78.

Litecoin also rose 4.14 percent to trade at $142.

Why is bitcoin rising?

Bitcoin maintains its bullish trend throughout the week as the cryptocurrency recovers from April 17’s tax sell-off.

Investors and analysts feared the US tax deadline on Tuesday would fuel a flurry of crypto-selling, driving prices down.

After a brief wobble, BTC recovered and has been rising steadily ever since.

Tom Lee, founder of hedge fund, Fundstrat, suggested pressure to sell off coins in response to the tax deadline would ease off in the weeks following.

And it appears that his prediction is correct, as prices float higher across the week.

US bitcoin investors owed around $25 billion in capital gains taxes for 2017 following a surge in its price in December, according to Mr Lee.

He told CNBC: “There is quite a lot of discussion in a lot of the crypto groups about the magnitude of tax selling.

“I think we ended up just taking a lot of these thoughts, putting it into a spreadsheet and we came up with an estimate that $25billion would be the tax bill owed to the IRS for realised gains for US households, which is a windfall for the IRS.

“The most that they ever received in capital gains in any single year was 144billion.”

It seems that investors are happy to dip back into the market, as the London Block Exchange (LBX) has discovered.

Speaking to Express.co.uk, LBX CEO, Benjamin Dives, said there has been a notable increase in the amount of Bitcoin, Ethereum, Litecoin and Ripple, handled by his firm.

He said: “The common assumption is that institutional investors shy away from new asset classes such as cryptocurrency.

"However, that’s not what we are seeing here at LBX; we've seen a huge uplift in institutional interest recently. Since Q1 2018, we're now handling many millions in trades each month.

“From hedge funds to pension funds, institutional investors are taking cryptocurrency seriously.

"At LBX, institutional investors have had access to our over-the-counter desk for some time, which allows investors to trade cryptocurrencies under preferential conditions for high volume orders."


Author OWEN GOUG UPDATED: 18:14, Thu, Apr 19, 2018


Posted by David Ogden Cryptocurrency Entrepreneur


David Ogden – Http://markethive.com/david-ogden

Looking Ahead To $20,000 Bitcoin

Looking Ahead To $20,000 Bitcoin

Looking Ahead To $20,000 Bitcoin

In last week’s Investor Alert, our investment team shared with you a report from Morgan Stanley that says Bitcoin’s price decline since December mimics the Nasdaq tech bubble in the late 1990s. This isn’t earth-shattering news in and of itself. The main difference is that the bitcoin rout happened at 15 times the rate as the tech bubble.

Morgan Stanley has some good news for Bitcoin bulls, however: The 70 percent decline is “nothing out of the ordinary,” and what’s more, such corrections “have historically preceded rallies.” Just as the Nasdaq gained back much of what it lost in the subsequent years—before the financial crisis pared losses even further—bitcoin could similarly be ready to stage a strong recovery.

One research firm, in fact, believes Bitcoin and other digital coins, or “alt-coins,” have likely found a bottom. New York-based Fundstrat, headed by strategist Thomas Lee, issued a statement to investors last week saying that, though a cryptocurrency bull market isn’t necessarily underway, the worst of the pain could be “largely over.”

Fundstrat research shows that periods of cryptocurrency consolidation, or “purgation,” generally last 70 to 231 days. Bitcoin hit its all-time high in mid-December, almost 70 days ago as of March 26. Taking into consideration Fundstrat’s estimates, then, it’s possible the bear market could conclude sometime between now and early August.
 

In the meantime, Lee writes, alt-coin investors should stick with larger-cap cryptocurrencies such as Bitcoin, Ethereum and Ripple.


Take the Long-Term View

It’s helpful to compare Bitcoin with Nasdaq, as Morgan Stanley did, but what about comparing the current cycle with one from the past?

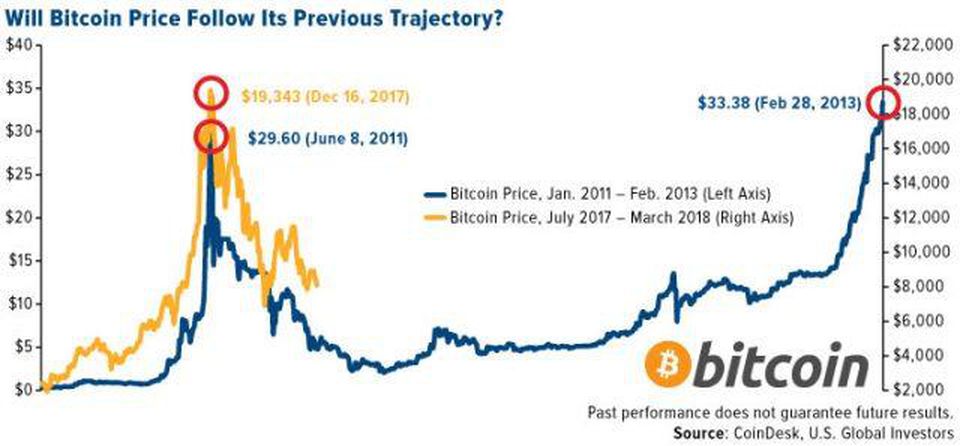
In June 2011, Bitcoin peaked at nearly $30 and found a bottom of $2.02 five months later, in November. It would be an additional 15 months before it returned to its former high. This might seem like a long time to some, but investors who managed to get in at the bottom would have seen their position grow more than 1,300%.

So can Bitcoin do the same today? Obviously no one can say for sure, but what I can say with certainty is that Bitcoin, like all digital coins, is highly volatile. Plus, there’s not quite 10 years’ worth of data, meaning it’s been difficult to identify trends.

Cryptocurrencies are also currently facing tougher oversight from several world governments and central banks, not to mention Facebook and Twitter’s bans on ads promoting them—obstacles they didn’t have to contend with back in 2011 and 2012.

But I remain bullish. Cryptocurrencies are still in their very early stages. To return to the comparison with tech stocks, we don’t know at this point which digital coins will be tomorrow’s equivalent of Amazon, Google, Apple and Facebook. A long-term view is key.

Finally, I still believe in the power of Metcalfe’s law, which says that as more and more people adopt a new technology—cell phones, for instance, or Facebook—its value goes up geometrically. A poll conducted in February shows that just under 8% of American adults report ever owning or purchasing any cryptocurrencies. Market penetration, then, hasn’t been as pervasive as some might expect, but as people increasingly become more confident in dipping their toes in the space, demand could rise and, with it, prices.


Author Frank Holmes


Posted by David Ogden Entrepreneur
David ogden Cryptocurrency entrepreneur

David Ogden – Http://markethive.com/david-ogden
Bitcoin (BTC) Daily Price Forecast – November 14

Bitcoin (BTC) Daily Price Forecast – November 14

Bitcoin (BTC) Daily Price Forecast – November 14

  • BTC/USD Medium-term Trend: Ranging
  • Resistance Levels: $6,800, $6,900, $7,000
  • Support levels: $6,300, $6,100, $5,900

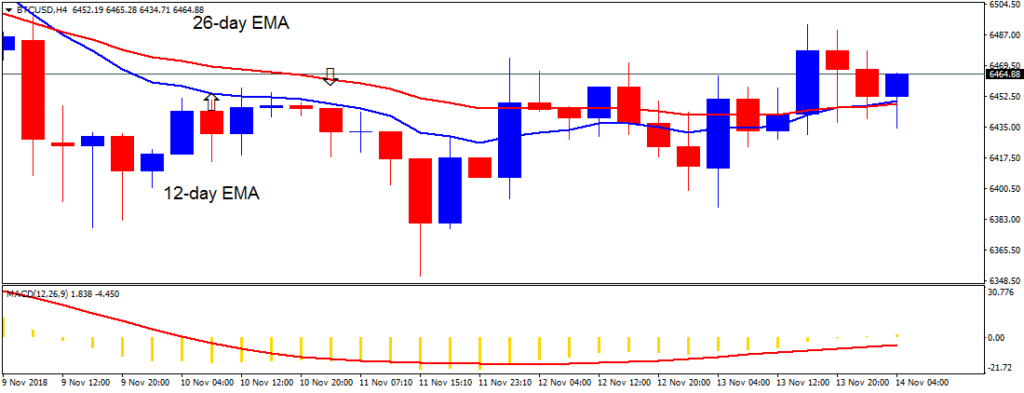
Yesterday, November 13, the price of Bitcoin was in a sideways trend. The crypto’s price had been in a sideways trend before price broke that level to the low of $6,300 on November 11. On November 13, the crypto’s price has resumed its sideways trend. Price of Bitcoin is now fluctuating above the $6,400 price level.

The 12-day EMA and the 26-day EMA are horizontally flat indicating the sideways trend. The small body’s candlesticks are indecisive candlesticks describing the indecision of buyers and sellers at the $6,400 price level. There will be no trade recommendation as the price of Bitcoin is still in a sideways trend. Meanwhile, the crypto’s price is above the 12-day EMA and the 26-day EMA indicating that price is likely to rise. The MACD line and the signal line are above the zero line which indicates a buy signal.

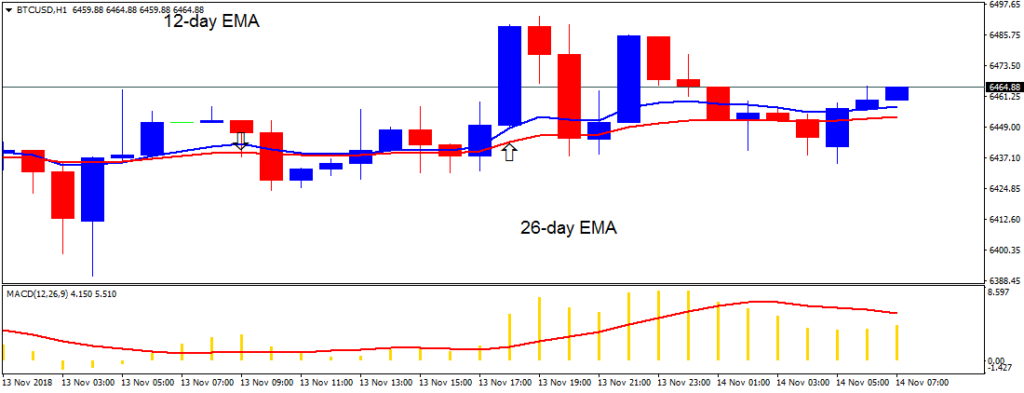
On the 1-hour chart, the price of Bitcoin is in a sideways trend. The price bars are fluctuating above the exponential moving averages. The MACD line and the signal line are above the zero line which indicates a buy signal.


By Azeez M – November 14, 2018

David Ogden – Http://markethive.com/david-ogden
Tom Lee Cuts $10,000 Off EOY Bitcoin Price Forecast

Tom Lee Cuts $10,000 Off EOY Bitcoin Price Forecast

Tom Lee Cuts $10,000 Off EOY Bitcoin Price Forecast

Per an article from CNBC, Tom Lee, Bitcoin’s inside man at Fundstrat Global Advisors, recently lowered his Bitcoin (BTC) price prediction by $10,000, claiming that this industry’s foremost asset will only hit $15,000 by year’s end, not $25,000 as he has stated incessantly on previous occasions.

Like his previous bitcoin price calls, the Fundstrat executive drew attention to the break-even cost of mining one BTC, which he believes correlates directly with the price of the digital asset. Lee noted that the break-even cost with Bitmain’s S9 machine has fallen to $7,000 from $8,000, adding that it would be fair for BTC to surpass 2.2 times that amount.

He also drew attention to the Bitcoin Cash contention, which is an ongoing epic, as seen by the endless tussle between Bitcoin ABC and Bitcoin Satoshi’s Vision. Like other analysts, Lee explained that recent bearish price action can be attributed to the hard fork, alluding to the fact that this so-called “civil war” is instilling feelings of distrust in crypto investors at large.

However, while Lee’s decision to cut $10,000 off his forecast may accentuate fleeting hints of bearish sentiment, the bottom line is that the Fundstrat’s in-house research savant isn’t ready to give up on BTC just yet, even though his dignity took a strong blow to the chin, so to speak.

Lee added:

While bitcoin broke below that psychologically important $6,000, this has lead to a renewed wave of pessimism… But we believe the negative swing in sentiment is much worse than the fundamental implications.

Other Insiders Remain Bullish On Crypto

Interestingly, Lee isn’t the only industry insider to be bullish on the short to mid-term prospects of this industry.

In early-October, Spencer Bogart, a partner at Blockchain Capital, explained that positive institutional news, like the arrival of TD Ameritrade, Yale, and the Intercontinental Exchange (ICE), will likely be the primary contributor to crypto’s impending bonfire (bull run), as it were.

Lee backed this claim, drawing attention to the looming launch of Bakkt and FDAS as “[a] part of a broader creation of infrastructure necessary for institutional involvement.”

In contrast, Nikolay Storonsky, CEO of Revolut, has recently claimed that retail investors will drive 2019’s crypto bull run, going against the popular sentiment that the launch of the institutional-focused Bakkt and Fidelity Digital Asset Services (FDAS) will propel crypto to Main Street after Wall Street fills their bags.

Others have begged to differ, but as always, investors, whether from the Bitcoin maximalist or altcoin advocate camp, have begun to exert their opinion that a cryptocurrency bull run is in the cards. However, at the time of writing, the crypto market has failed to recover, with BTC and its altcoin brethren posting losses of 2-3%.

David Ogden – Http://markethive.com/david-ogden

Buying Bitcoins Recent Dip Could Be Profitable, Chart Watcher Points Out

Buying Bitcoins Recent Dip Could Be Profitable, Chart Watcher Points Out

Buying Bitcoins Recent Dip Could Be Profitable, Chart Watcher Points Out

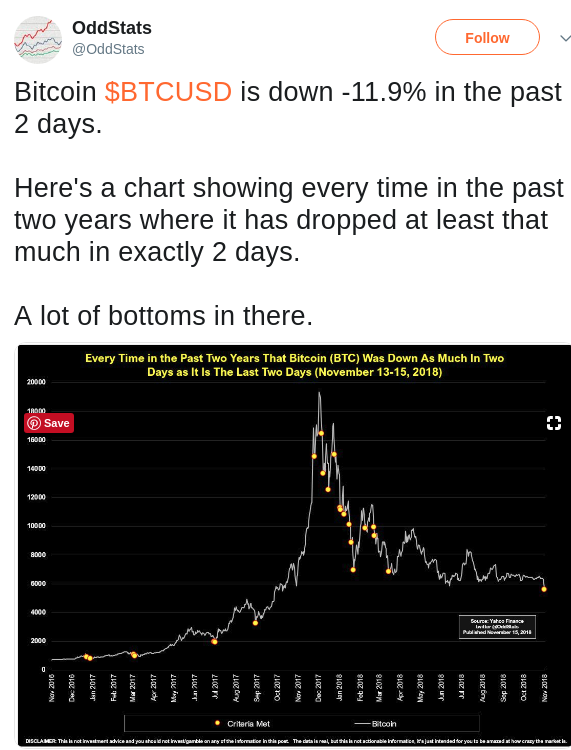
Earlier this week, bitcoin saw its price drop nearly 12% in a single day, taking it below the $6,000 mark and breaking a longstanding support just under said mark. The day after, bitcoin hit a new yearly low under $5,500. The dip may be a profitable opportunity, according to one chart watcher.

As first reported by MarketWatch, Twitter user OddStats revealed that, throughout bitcoin’s history, large two-day sell-offs are usually followed by short rallies that can be profitable.

Using the Twitter users’ analysis it’s possible to see that in some cases it could’ve been extremely profitable to buy the dip, as long as it dropped over 10% in two days. The last time it occurred, at the end of March, BTC dropped roughly 14%, to about $6,840.

Those who bought the dip then would’ve seen their coins go up a whopping 46% in the next few weeks, as the flagship cryptocurrency then surged to nearly $10,000. As MarketWatch points out, in early February, the strategy would’ve been profitable as well.

At the time, BTC fell over 24.5% in said time period, but quickly recovered as in the next two weeks the cryptocurrency jumped roughly 72%. While in hindsight the strategy looks profitable, some of the microblogging website’s users have pointed out it would be hard to time the market, and that the data may not be representative.

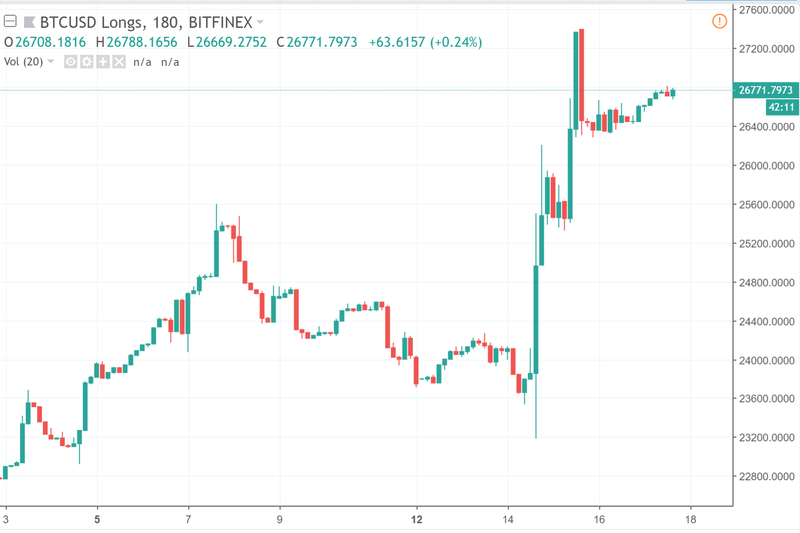
Nevertheless, bitcoiners have seemingly been buying the recent dip. Data from the popular cryptocurrency exchange Bitfinex shows the number of long contracts surged from about 23,700 to roughly 26,700 in a few days.

As MarketWatch points out, the outstanding long interest is currently at its highest level since October 11. The two-day sell-off strategy, however, may have its flaws.

Late last year, when bitcoin hit its all-time high close to $19,000, the criteria were met on December 19-20. Buying the cryptocurrency then would’ve set traders down a further 20%, as the cryptocurrency kept on dipping.

David Ogden – Http://markethive.com/david-ogden