Bitcoin (BTC) Price Watch – Bears Refusing to Let Up
Bitcoin Price Key Highlights
-
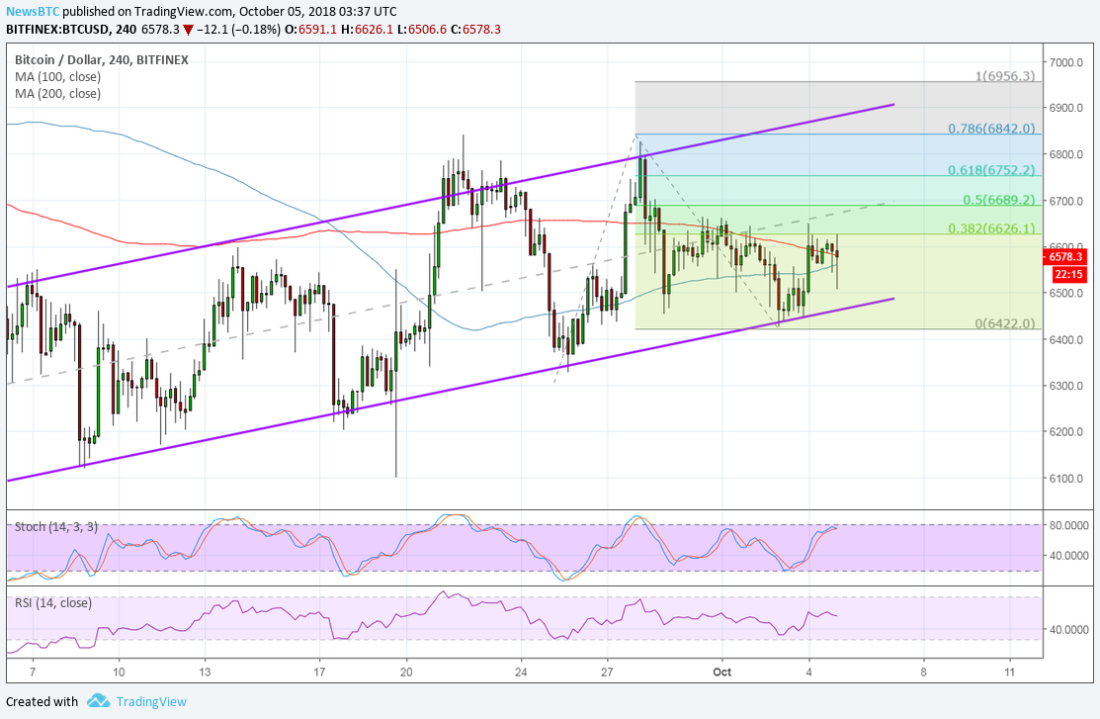
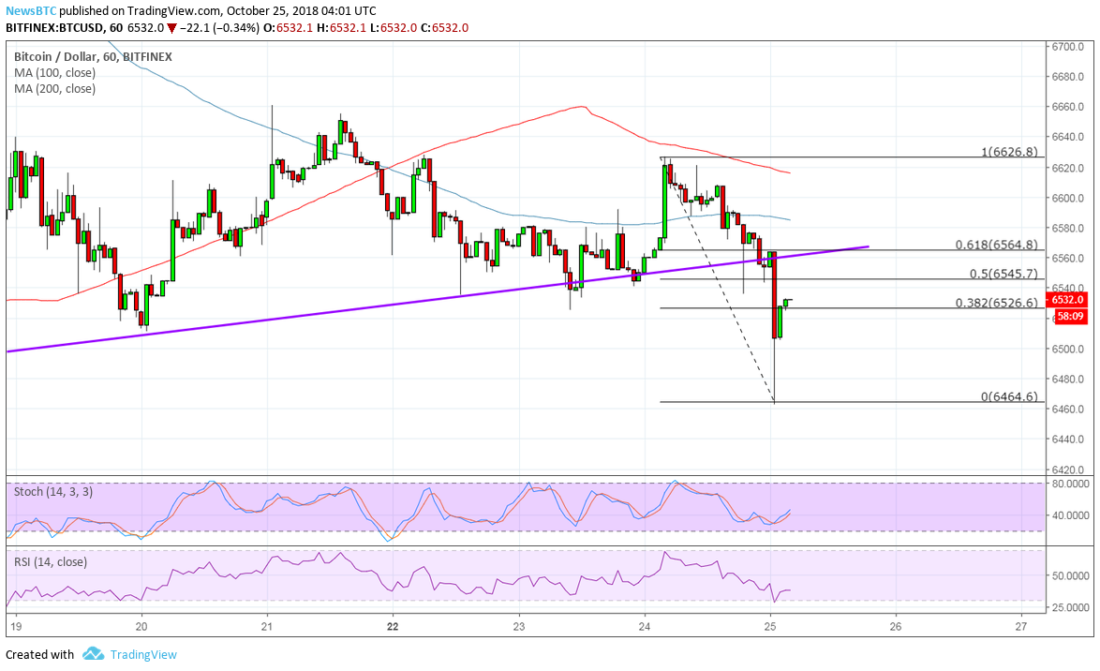
Bitcoin price recently tumbled below a short-term rising trend line but might be due for a pullback.
-
Applying the Fib retracement tool on the latest swing high and low shows the levels where more sellers might be waiting.
-
However, technical indicators are giving mixed signals on whether the slide could resume or not.
Bitcoin price fell through a short-term support zone and might be due for a pullback before heading further south.
Technical Indicators Signals
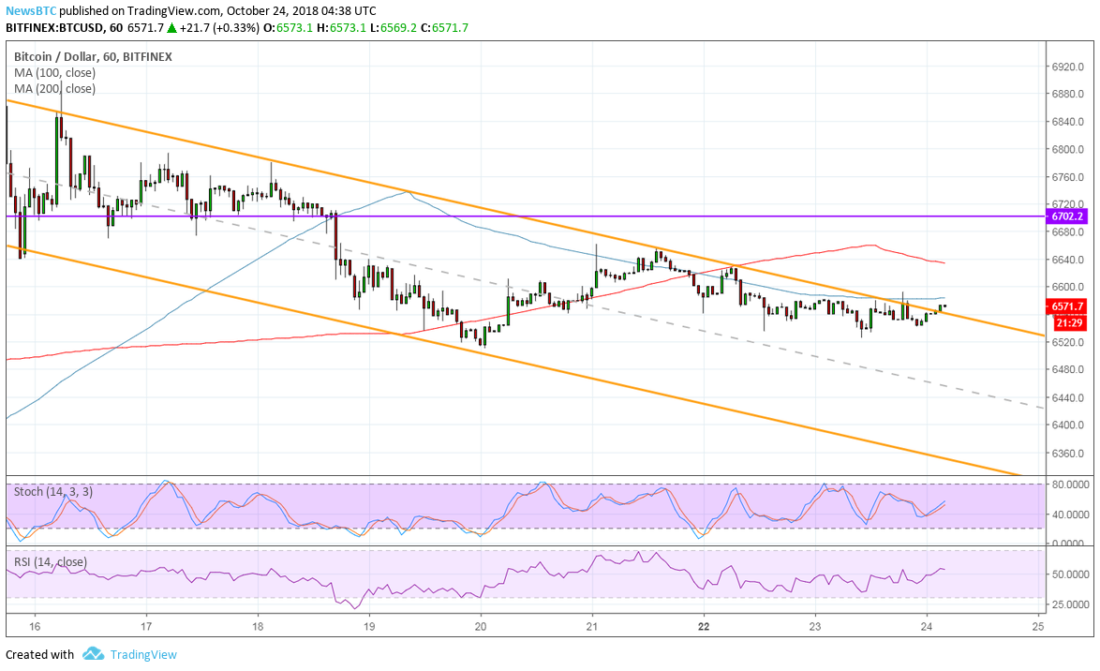
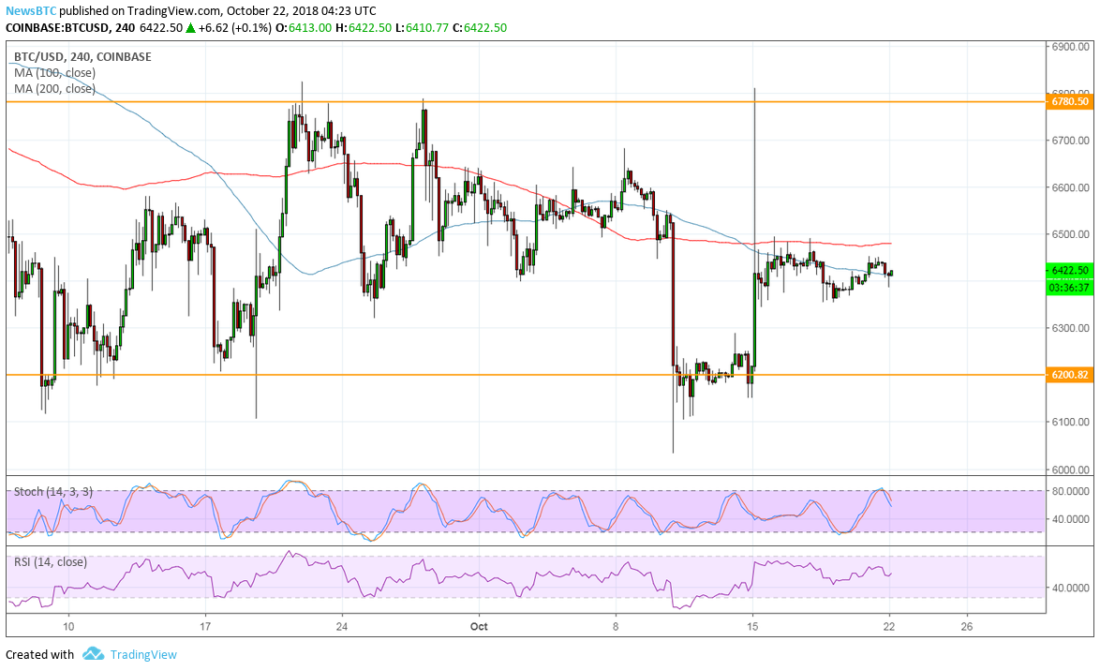
The 100 SMA is below the longer-term 200 SMA to indicate that the path of least resistance is to the downside. In other words, the selloff is more likely to resume than to reverse from here.
Sellers might be waiting around the 61.8% Fib or $6,564 level which lines up with the broken rising trend line support. This is also close to the 100 SMA dynamic inflection point, which might add another layer of resistance.
Stochastic is pulling up without even hitting oversold territory, which suggests that buyers are eager to return. Sustained buying pressure could even take bitcoin price back up above the trend line to continue its climb. RSI is also pointing up to suggest that buyers might be ready to return. Reaching overbought levels and turning back down could still allow the Fibs to hold, pushing bitcoin price back to the swing low or lower.
Bitcoin was unable to sustain its earlier pop higher as profit-taking was quick. Traders must be feeling anxious on account of risk-off flows in general financial markets and while waiting for the SEC decision on bitcoin ETF applications.
Still, there’s a lot to look forward to, particularly the launch of ICE Bakkt bitcoin futures later this year. However, there might also be some unease as traders recall that last year’s CME bitcoin futures were blamed for the sharp drop that followed then.
SARAH JENN | OCTOBER 25, 2018 | 4:24 AM
David Ogden – Http://markethive.com/david-ogden

