BITCOIN REVOLUTION -Is it legit or a scam?

BITCOIN REVOLUTION – Is it legit or a scam?

Bitcoin Revolution is an investment scheme that has been operating online for several years and, despite the growing number of warnings, there are still plenty of people around the world who think that it just might be for real.

Anyone who has spent time in the crypto trenches knows to stay away from Bitcoin Revolution, but that hasn’t stopped less savvy people from falling prey to its claims of earning massive profits for a minimal investment.

Interest in the investment scheme appears to be especially pronounced in Australia and Europe, where searches for ‘bitcoin revolution’ have climbed higher than 12,000 per month in some countries.

In Australia, Google Trends reports that over the past week, two of the five most searched for Bitcoin-related search terms are related to Bitcoin Revolution.

Most of the searches appear to be related to researching the scam, with phrases like ‘is bitcoin revolution legit’ and ‘bitcoin revolution review’ leading the pack.

A flood of fake celebrity endorsements

One tactic that Bitcoin Revolution uses is to promote its investment scheme through the use of fake celebrity endorsements which frequently appear on Facebook, Instagram, and other platforms.

A laundry list of celebrities have unwittingly had their name and image used to promote Bitcoin Revolution, including actors Kate Winslet and Hugh Jackman, TV personalities Simon Cowell and Jeremy Clarkson, and even political figures like Goh Chok Tong, the former prime minister of Singapore.

Facebook has come under fire for allowing the ads, which typically feature a well-known celebrity or public figure waxing enthusiastic about how much they have made through their investments on the platform.

Governments warn against Bitcoin Revolution

Just last week, the Malta Financial Services Authority (MFSA) issued a warning about a scam called Bitcoin Future.

In the warning, the agency noted that “this entity appears to present the same deceitful characteristics as another entity, Bitcoin Revolution.”

The MFSA had previously issued two separate warnings about Bitcoin Revolution in January and August of this year, cautioning its citizens that “information available to the MFSA suggests that Bitcoin Revolution is likely to be an international “get-rich-quick” cryptocurrency scam.”

“The public should, therefore, refrain from undertaking any business or transactions with the entity operating under the name of Bitcoin Revolution,” it added.

In the United Kingdom, the Financial Conduct Authority issued its own warning about similar scams last year.

While it did not specifically mention Bitcoin Revolution, the FCA did warn about a similar scam called Bitcoin Loophole.

A closer look at Bitcoin Revolution (Evolution)

To decide for myself whether or not Bitcoin Revolution was legit, I created dummy accounts at three separate websites running the same-named scam.

Scam A: the-bitcoinrevolution(dot)com – I found this one searching Google for ‘bitcoin revolution’.

Scam B: profittoday(dot)net/ck/bitrevolution/ – I found this stumbling across a fake ad in which actor Robert De Niro purportedly claims to be earning “tens of thousands of euros a day” from the investment scheme.

Scam C: securelywealth(dot)com/bitcoinevolution/ – This comes from the same fake ad in which actor Hugh Jackman supposedly announced his retirement from acting due to the massive amounts of money he was making.

Note: Since Micky originally reported on the Hugh Jackman story, the website has since changed its name from Bitcoin Revolution to Bitcoin Evolution.

All three websites make the same claims – in fact, I would estimate that 80% of the content is identical from one website to the next.

Using “proprietary” automatic trading software, the websites claim that users can expect to earn as much as $1,000 to $1,300 per day.

The software is so powerful, the scam states, that some users “earned their first million within just 61 days.”

Same scam, three different platforms

Using a fake name, email address, and phone number, I created accounts on all three websites.

The signup process was quick and simple – no proof of identification or other KYC steps needed.

Once logged in, the first thing I noticed was that each website had different software powering its trading platform.

Scam A was the only one that appeared to have its own platform. Scams B and C use third-party software from MonumentTrade and GeneralTrade, respectively.

Scam A also had a demo version of their platform, which was nice. I pretend-earned over US$200 in less than fifteen minutes.

Had I actually decided to deposit money into those accounts, Scams A and B would have required me to speak with a broker or account manager. Scam C uses a payment processor called VoguePay to enable deposits using a Visa, Mastercard, or existing VoguePay digital wallet.

All three websites boast that their trading software has won “numerous awards” including “first place in the Trading Software category for the US Trading Association,” which is odd considering that no resident of the United States can use the websites.

I tried to ask for help and got nothing

None of the websites listed any contact or business registration information and a WHOIS search on all three domains showed that each owner was hiding behind a proxy service.

The only reference at all to support or customer service was on Scam A’s website. In the FAQ section at the bottom of the page, it reads:

“At Bitcoin Revolution, we are always here for you and our professional and responsive customer service team can be contacted at any time.”

Unfortunately, the only means of contacting them is through a contact form that returns an error whenever an email is submitted.

Scam B’s contact page doesn’t even exist and an email sent via the contact form on Scam C’s website has yet to send the promised confirmation email and the ticket link they provided was broken as well.

So is Bitcoin Revolution legit or is it a scam?

I’m going to have to go with a resounding SCAM on this one. There are enough red flags surrounding Bitcoin Revolution to cover a football field.

Just to recap:

  • Fake celebrity endorsements
  • Impossibly outrageous profit claims
  • Multiple governments issuing warnings about it
  • Scheme operating under multiple domain names
  • Each copy of the scheme uses different trading platform software
  • No business registration information
  • No functioning means of contacting anyone

As Bitcoin scams go, Bitcoin Revolution / Evolution is particularly prolific and has been running in one form or another since at least 2017.

No sooner does one site get taken down than another one pops up.

Sadly, as interest in cryptocurrency continues to grow, so too will Bitcoin Revolution’s victim pool.

Don’t be one of them – do your due diligence before making any investment decisions.


By Cynthia Turcotte -November 5, 2019

David Ogden – Http://markethive.com/david-ogden

Can the Bitcoin BTC Price Surge 72 to Hit 16000?

Can the Bitcoin (BTC) Price Surge 72% to Hit $16,000?

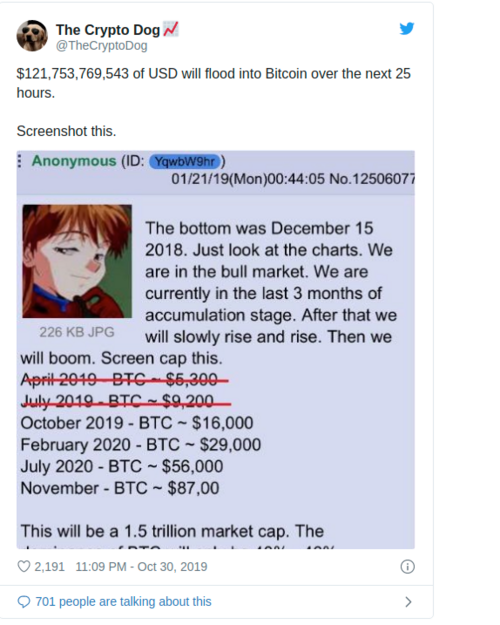
Last week, crypto investors were making much ado about a Bitcoin prediction that stated that the cryptocurrency would surmount $16,000 in October. As you likely know, this didn’t come true, with the cryptocurrency ending the month at around $9,300 — dozens of percent shy from the $16,000 predicted by the anonymous 4Chan predictor.

While this was a crushing blow to the Bitcoin optimists, there is still hope that the leading cryptocurrency will soon hit $16,000. That would represent a 72% rally from the current price of $9,200.

A $16,000 Bitcoin?

Changpeng “CZ” Zhao, the much-beloved chief executive of Binance, recently noted that Bitcoin may “see $16,000 soonish.” More specifically, he wrote that:

Lol, price predictions are easy. It’s just hard to be right about the timing. We will see $16k soon-ish. 1.4 billion people working on it as we speak.

The prominent cryptocurrency entrepreneur looked to the fact that China has just embraced blockchain technologies, which many analysts expect to have a positive trickle-down effect on decentralized cryptocurrencies and blockchains like Bitcoin and Ethereum. As one individual put it, blockchain is the gateway drug to BTC.

While CZ may be seen as too optimistic by cryptocurrency investors, there are some analyses that predict that BTC will soon begin to approach that range.

As reported by Ethereum World News, BitcoinGuru said that a massive head fake that Bitcoin just saw clearly satisfies a fractal — when historical price action plays out on current time frames at a different magnitude — that he has been tracking for a while now.

The fractal suggests that the recent drop and subsequent recovery is predicting a massive resurgence, one that will bring Bitcoin higher than its $14,000 year-to-date peak. He wrote that if Bitcoin closes around current levels, he expects for $16,000 to be reached by November 16th.

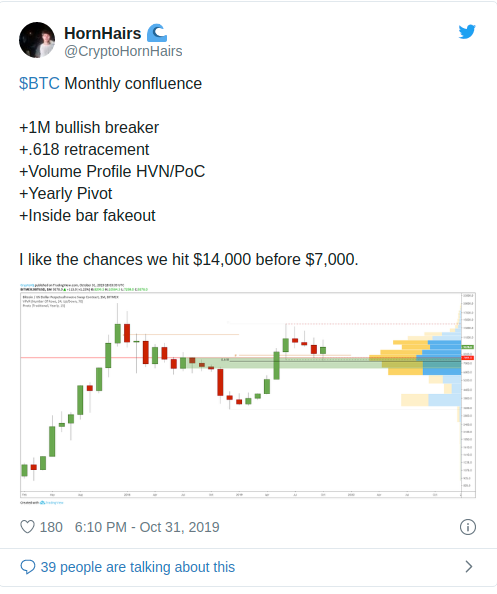
That’s far from the end of it. Trader HornHairs has noted that he “likes the chance we hit $14,000 before $7,000.” He remarked in a recent tweet that with BTC bouncing strong and holding above the one-month bullish breaker, the 0.618 Fibonacci Retracement of the entire cycle, the Point of Control as defined by the volume profile, and the yearly pivot, BTC is leaning rather bullish.

Nick Chong by Nick Chong November 4, 2019in Bitcoin News

David Ogden – Http://markethive.com/david-ogden

Bitcoin BTC Price Weekly Forecast: Signs of Bullish Continuation

Bitcoin (BTC) Price Weekly Forecast: Signs of Bullish Continuation

  • There are positive signs emerging for bitcoin above the $9,200 support against the US Dollar.

  • The price is slowly moving higher and it could retest the $9,770 resistance area in the near term.

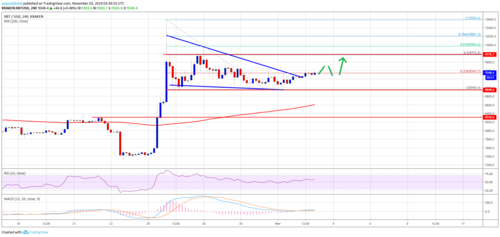
  • There was a break above a key contracting triangle with resistance near $9,240 on the 4-hours chart of the BTC/USD pair (data feed from Kraken).

  • The price remains well supported and it could even surge above $9,800 in the coming days.

Bitcoin price is trading above key supports near $9,000 and $9,200 against the US Dollar. BTC must stay above $8,600 to remain in uptrend and start a fresh increase.


Bitcoin Price Weekly Analysis (BTC)

This past week, there was a slow and steady decline in bitcoin below the $8,400 support against the US Dollar. Moreover, BTC price also traded below the $8,200 support area. Finally, it spiked below the $8,000 support, but remained well above the 100 simple moving average (4-hours).

A swing low was formed near $8,960 and the price recently started an upward move. There was a break above the $8,100 and $8,200 resistance levels to start a decent increase.

More importantly, there was a break above a key contracting triangle with resistance near $9,240 on the 4-hours chart of the BTC/USD pair. At the moment, the price is trading near the 23.6% Fib retracement level of the downward move from the $10,584 high to $8,960 low.

If there are more gains, the price could continue to rise towards the $9,500 and $9,600 resistance levels. Besides, the main resistance is near the $9,770 level. It represents the 50% Fib retracement level of the downward move from the $10,584 high to $8,960 low.

On the downside, there are many supports between $9,200 and $8,960. If there is a bearish break below the $8,960 swing low, there are chances of a sharp decline. The next key support is near $8,600 and the 100 simple moving average (4-hours).

Therefore, the $8,500 and $8,600 support levels are likely to play an important role. As long as the price is above the $8,500 support, there are chances of a fresh increase above the $9,500 level.

Bitcoin Price

Looking at the chart, bitcoin price is clearly showing signs of bullish continuation above $9,500. Having said that, a clear break above the $9,500 and $9,770 resistance levels is needed for uptrend acceleration. In the mentioned case, the price is likely to revisit $10,580.

Technical indicators

4 hours MACD – The MACD for BTC/USD is slowly gaining pace in the bullish zone.

4 hours RSI (Relative Strength Index) – The RSI for BTC/USD is now moving well above the 50 level.

Major Support Level – $8,960

Major Resistance Level – $9,500


Aayush Jindal

David Ogden – Http://markethive.com/david-ogden
Here Is Bitcoin’s Ideal Buying Price According to One Analyst

Here Is Bitcoin’s Ideal Buying Price (According to One Analyst)

On November 1, it was announced that the first regulated Bitcoin fund that has been available in North American exchanges will also be released in Canada.

3iQ Corp, a Canada based company received confirmation from the Ontario Securities Commission (OSC) in order to list ‘The Bitcoin Fund’ on Canada’s stock exchange. This is expected to be done by the end of 2019.

While the news has been positive, the Bitcoin price movement has been confusing, to say the least. The price has been gradually decreasing since October 25’s rapid upward move.

Cryptocurrency trader @davethewave speculated that the ideal buying price for Bitcoin is at $6700. According to our analysis, the ideal buying price may be in the low $7000s or high $6000s.

Additionally, he suggested that averaging in would be ideal — but what does that mean? Let’s analyze both the ideal price and the concept of averaging in.

Pitchfork & Volume

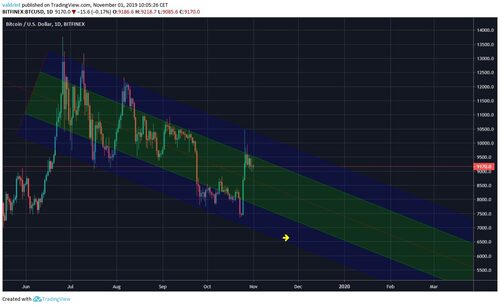
@davthewave used a pitchfork to create a descending channel and determine future price movement.

The ideal buy zone falls within the lower portion of the channel (blue). Since it is descending, the ideal buy price is decreasing as time goes by.


BTC Channel

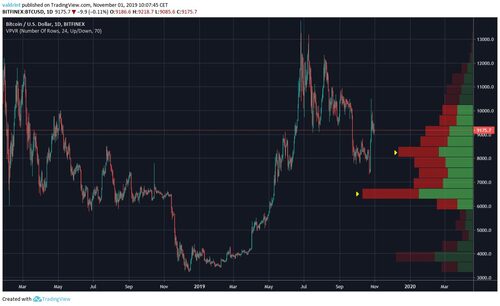
When using the Volume profile indicator, we can see that the strongest buy area is found near $6500 — coinciding well with the buy zone given by the channel.

A decrease below this level could trigger a rapid Bitcoin price decrease.

Long-Term Bitcoin Price Analysis

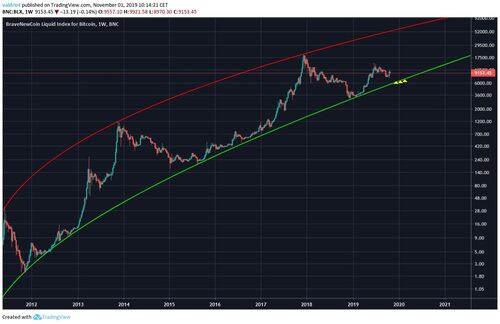
Using a logarithmic chart and curved trendlines, we can see that the support line is currently at $6300 and is slowly moving upward. Therefore, we agree that the ideal buying price may be around $6700.

The concept of averaging-in means placing several orders around an average price. One example of the $6700 price would mean buying with 1/3 of the total amount of your order at $6900, 1/3 at $6700 and 1/3 at $6500.


Valdrin Tahiri 1 min ago

David Ogden – Http://markethive.com/david-ogden

After the recent surge in price by BTC other crypto currencies are making positive moves after attaining a bullish break Binance Coin NEO Bitcoin SV are making positive moves except for Stellar and IOTA

After the recent surge in price by BTC, other crypto currencies are making positive moves after attaining a bullish break. Binance Coin, NEO, Bitcoin SV are making positive moves except for Stellar and IOTA.

The selling pressures are being exhausted as the bulls take control of the price. The bullish market can equally be sustained if buyers are introduced at the demand zones.

BNB/USD Major trend: Bullish

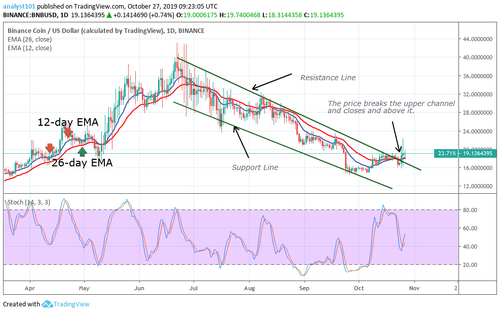
On October 24, the BNB price finally broke the resistance line of the descending channel which indicates a positive sign. This may signal the end of the downtrend if the bulls sustain the price above the channel. The market is above the 40% range of the daily stochastic indicator which means that price is in a bullish momentum. Nevertheless, from the price action, if the bulls break above the previous highs of $20 and $24 price levels, the pair will be out of the downtrend zone.

NEO/USD Major trend: Bullish

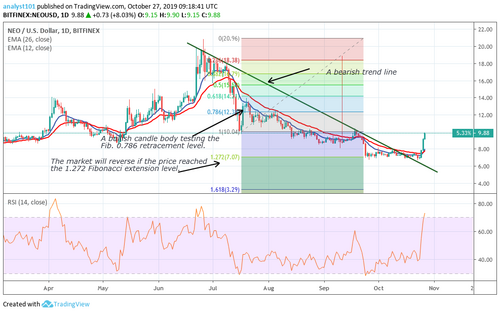
The NEO/USD pair has made a more positive move than Binance Coin as the bulls took control of price. The coin will be out of the downtrend zone if it overcomes the resistance levels of $10 and $ 12. The market is approaching the overbought region of the Relative Strength Index period 14 level70. In other words, the market is in the bullish trend zone. The Fibonacci tool confirms that the market will reverse at the 1.272 extension level because a bullish candle body tested the 0.786 retracement level.

XLM/USD Major trend: Ranging

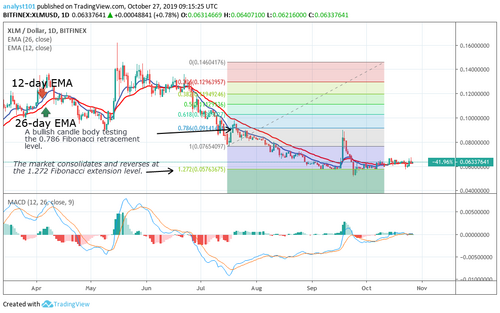
In October, Stellar has been consolidating above the $0.060 support level after the last bearish impulse. The bulls and the bears are undecided about the direction of the market for the past month. The 12-day and 26-day EMAs are trending horizontally indicating that price is in a sideways movement. According to the Fibonacci tool, Stellar may as well reverse at the 1.272 extension level.

BSV/USD Major trend: Bullish

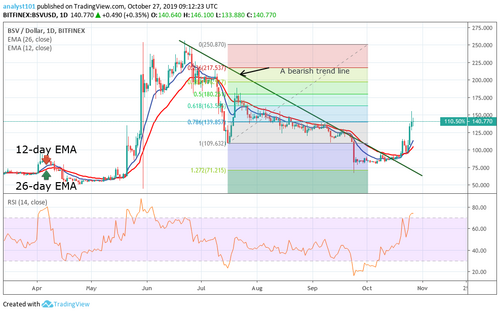
Bitcoin SV is making another positive move as the price breaks the bearish trend line and reaches the previous highs. Presently, it is facing resistance at the $150 price level. The coin is in the bullish trend zone. Nevertheless, if the price continues its upward move, and the $150 and $175 resistance levels are broken, the coin will attain a previous high of $250 supply zone. The market is trading in the overbought region of the Relative Strength Index period 14 levels 69.

IOTA/USD Major trend: Ranging

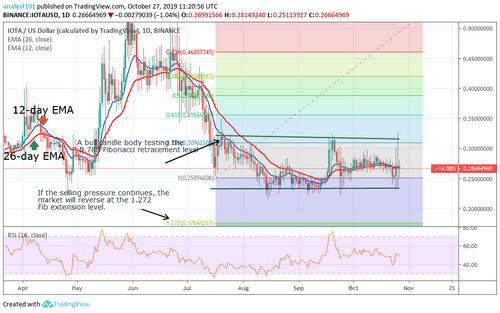
In October, the IOTA/USD pair has been consolidating in a tight range. The market fluctuates between the levels of $0.25 and $0.28. This consolidation in a tight range was as a result of the failure of the bulls to break the $0.30 resistance level. Likewise, the bears were unable to break below the $0.25 support level. Meanwhile, the Fibonacci tool indicates that IOTA is likely to fall to the 1.272 extension level. The Relative Strength Index period 14 level 47 explains that IOTA is in a sideways move.


Oct 28, 2019 at 09:41 // NEWSAuthor

Coin Ido

David Ogden – Http://markethive.com/david-ogden
Bitcoin BTC Price Consolidating Gains Bulls Eyeing Fresh Increase

Bitcoin (BTC) Price Consolidating Gains, Bulls Eyeing Fresh Increase

  • Bitcoin price is currently consolidating above the key $9,000 support area against the US Dollar.

  • The price is struggling to gain bullish momentum above the $9,600 and $9,720 resistance levels.

  • There is a connecting bearish trend line forming with resistance near $9,560 on the hourly chart of the BTC/USD pair (data feed from Kraken).

  • The price must climb above $9,600 and gain pace above $9,720 to continue higher in the near term.

Bitcoin price is likely setting up for the next major break against the US Dollar. BTC remains well supported above $9,000 and it could climb higher towards $10,000.

Bitcoin Price Analysis

Recently, bitcoin price climbed towards the $10,000 resistance area against the US Dollar. However, BTC failed to continue higher and formed a high near the $9,935 level.

Later, there was a fresh decline below the $9,600 and $9,500 support levels. The price traded close to the $9,100 support area and remained well bid above the 100 hourly simple moving average. The recent low was near $9,194 and the price is currently climbing steadily.

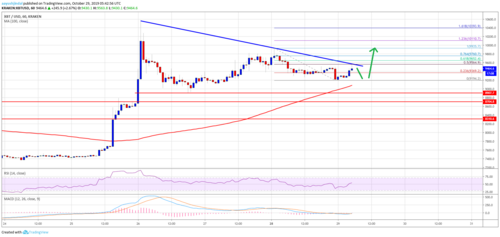
There was a break above the 23.6% Fib retracement level of the recent decline from the $9,935 high to $9,194 swing low. At the outset, bitcoin is testing the $9,500 and $9,550 resistance levels. Additionally, there is a connecting bearish trend line forming with resistance near $9,560 on the hourly chart of the BTC/USD pair.

More importantly, the 50% Fib retracement level of the recent decline from the $9,935 high to $9,194 swing low is acting as a hurdle for the bulls. Therefore, an upside break above the $9,550 and $9,600 levels is needed for a fresh increase.

The next major resistance is near the $9,720 level, above which the price could rise steadily towards the $10,000 resistance area. If the price accelerates above $10,000, it could revisit the $10,500 zone.

Conversely, if the price fails to break the $9,550 and $9,600 resistance levels, there could be another downward move. An immediate support is near the $9,200 area. Having said that, the main support is near the $9,000 level and the 100 hourly SMA.

Looking at the chart, bitcoin seems to be consolidating nicely above the $9,000 and $9,200 levels. As long as there is no close below the 100 hourly SMA, there are chances of a fresh increase towards the $10,000 and $10,200 levels in the coming sessions.

Technical indicators:

Hourly MACD – The MACD is showing positive signs in the bullish zone

Hourly RSI (Relative Strength Index) – The RSI for BTC/USD is moving higher and it is currently near the 50 level.

Major Support Levels – $9,200 followed by $9,000.

Major Resistance Levels – $9,550, $9,600 and $9,720.


Aayush Jindal

David Ogden – Http://markethive.com/david-ogden
Bitcoin BTC Price Steadies Uptrend But Another Correction Likely

Bitcoin (BTC) Price Steadies Uptrend But Another Correction Likely

  • Bitcoin price is gaining bullish momentum and is trading above $9,500 against the US Dollar.

  • The price is facing a strong resistance on the upside near the $9,820 and $9,850 levels.

  • There is a crucial bullish trend line forming with support near $9,500 on the hourly chart of the BTC/USD pair (data feed from Kraken).

  • The price could correct in the short term towards $9,200 before another rally.

Bitcoin price is trading in a steady uptrend above $9,000 and $9,200 against the US Dollar. BTC is likely to climb steadily with a few downward moves.

Bitcoin Price Analysis

This past week, there was a sharp rally in bitcoin above the $7,500 and $8,000 resistances against the US Dollar. BTC even surged above the $9,500 and $10,000 levels before correcting lower.

Later, the price corrected below the $9,500 support and the $9,000 pivot zone. However, the decline was contained below $9,000 and the price remained well above the 100 hourly simple moving average.

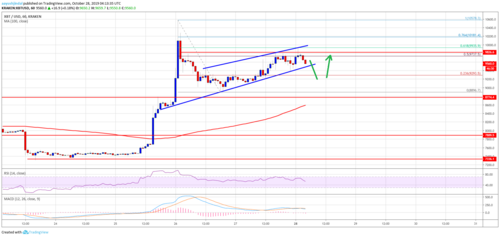
A low was formed near $8,896 and bitcoin started a fresh increase. It broke the $9,000 and $9,200 resistance levels. Moreover, there was a break above the 50% Fib retracement level of the downward correction from the $10,578 high to $8,896 low.

However, the price seems to be facing a strong resistance near $9,850 and $9,900. Besides, the 61.8% Fib retracement level of the downward correction from the $10,578 high to $8,896 low prevented any further upsides.

At the moment, the price is declining and is moving towards the $9,500 support. More importantly, there is a crucial bullish trend line forming with support near $9,500 on the hourly chart of the BTC/USD pair.

If there is a downside break below the trend line, the price could extend its downward correction towards the $9,200 level. Any further losses may perhaps push bitcoin price towards the $8,750 support area.

Conversely, if the price continues to climb higher, it could climb above the $9,850 and $9,900 resistance. The main hurdle is near the $10,000 level, above which the price is likely to climb towards $10,500.

Bitcoin price

Looking at the chart, bitcoin is showing a lot of positive signs above the $9,500 and $9,200 levels. However, there are a few chances of anther downward move towards $9,200 or $9,000 to complete the correction. Once the price completes the current correction, it is likely to surge above $10,000 or even $10,500.

Technical indicators:

Hourly MACD – The MACD is slowly moving into the bearish zone.

Hourly RSI (Relative Strength Index) – The RSI for BTC/USD is correcting lower and it might test the 50 level.

Major Support Levels – $9,500 followed by $9,200.

Major Resistance Levels – $9,850, $9,900 and $10,000.


Aayush Jindal

David Ogden – Http://markethive.com/david-ogden

Bitcoin BTC Price Weekly Forecast – Is This Real Bullish Break?

Bitcoin (BTC) Price Weekly Forecast – Is This Real Bullish Break?

  • There was a strong rise in bitcoin price from above $8,000 and $9,000 against the US Dollar.

  • The price even spiked above the $10,000 resistance, but it failed to hold gains and declined.

  • There is a short term bullish trend line forming with support near $9,080 on the 4-hours chart of the BTC/USD pair (data feed from Kraken).

  • The price could bounce back as long as it is trading above the $8,600 and $8,500 support levels.

Bitcoin price is trimming gains after a sharp rally against the US Dollar. BTC must stay above $8,500 to start a fresh increase. If not, it could dive back to $8,000.

Bitcoin Price Weekly Analysis (BTC)

In the past two days, there were heavy swing moves in BTC from the $7,500 support against the US Dollar. The BTC/USD pair rallied more than 20% and broke many hurdles near $8,500 and $9,000.

Moreover, there was a close above the $8,500 resistance area and the 100 simple moving average (4-hours). Finally, the price rallied above the $10,000 resistance and traded close to the $10,600 resistance area.

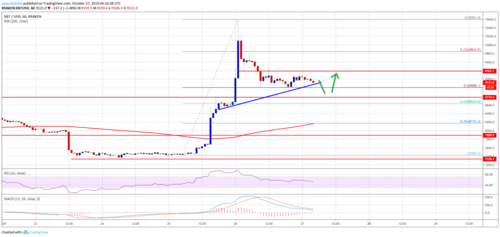
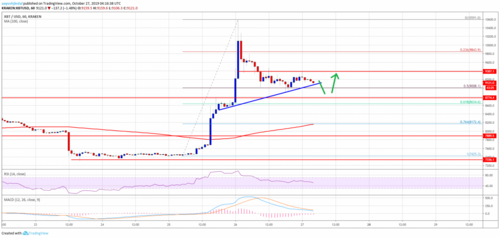
However, the bulls failed to remain in control and a top was formed near $10,591. Later, there was a strong downside correction below the $10,000 level. The price traded below the 23.6% Fib retracement level of the rally from the $7,425 swing low to $10,591 high.

Besides, the price traded below $9,500 and tested the $9,000 support area. Besides, it seems like the 50% Fib retracement level of the rally from the $7,425 swing low to $10,591 high is currently acting as a strong support.

More importantly, there is a short term bullish trend line forming with support near $9,080 on the 4-hours chart of the BTC/USD pair. If there is a downside break below the trend line and $9,000, bitcoin price could test the next major support near the $8,600 area.

The $8,600 and $8,500 levels are crucial supports since they acted as hurdles previously. Additionally, the 61.8% Fib retracement level of the rally from the $7,425 swing low to $10,591 high might also provide support.

Therefore, the $8,500 support is likely to act as a major support. If the price fails to stay above $8,500, it could move back into a downtrend.

Looking at the chart, bitcoin price is clearly trimming gains and approaching a few key supports near $9,000 and $8,600. If it fails to stay above $8,500, the recent rally could completely reverse in the coming days.
 

Technical indicators

4 hours MACD – The MACD for BTC/USD is slowly moving in the bearish zone.

4 hours RSI (Relative Strength Index) – The RSI for BTC/USD is moving lower and is close to the 50 level.

Major Support Level – $8,500

Major Resistance Level – $9,500


Aayush Jindal

David Ogden – Http://markethive.com/david-ogden

Traders Beware Indicator Signals Massive Bitcoin Volatility is Inbound

Traders Beware Indicator Signals Massive Bitcoin Volatility is Inbound

Bitcoin (BTC) has been caught in the throes of consolidation for the past several weeks and months, and it has failed to garner any momentum in either direction in the time since it plummeted below $10,000.

This period of consolidation may soon be coming to an end, however, as one technical indicator is elucidating that a massive movement may be imminent, and one analyst believes that Facebook’s Libra may play a role in BTC’s future volatility.

Bitcoin Consolidates as Bulls and Bears Remain Deadlocked

At the time of writing, Bitcoin is trading down marginally at its current price of $8,250, and its buyers have failed to significantly extend the upwards momentum that it incurred in the time since it visited $7,900 late last week.

Bitcoin has been caught in a relatively tight trading range between roughly $7,800 and $8,800, with significant support at the former price and strong resistance at the latter price.

It is important to note that this period of sideways trading has come about after Bitcoin’s massive drop from its previous support level at $10,000, and although the mid-term trend remains bearish, the noteworthy support that has been established at $7,800 may mark a long-term bottom for the cryptocurrency.

In a recent report on Bloomberg, it is noted that Bitcoin’s Trading Envelope indicator is currently at its narrowest since mid-September, which means that another massive movement may be imminent for the cryptocurrency.

“The gauge smooths moving averages to map out higher and lower limits and a similar narrowing last month preceded a drop of more than 12% for Bitcoin on Sept. 24,” the report explained.

Facebook’s Libra May Contribute to BTC Volatility

Detailed in the same report, Matt Maley, an equity strategist at Miller Tabak + Co., explained to Bloomberg that he believes the fate of Facebook’s Libra is currently contributing to BTC’s price action, and that the crypto will only be able to resume its standard market cycles ones the headwinds from Libra die down.

“As it becomes more and more obvious that the Libra thing is not going to take off – it’s going to be a long time before it becomes an important part of anything Facebook’s doing – as that becomes more obvious, the volatility will pick up again… This issue with what’s going on with Libra and Facebook is a definite headwind and it’s not going to go away.”

Although it does remain unclear as to whether or not Libra is truly having any significant influence on Bitcoin’s price action, as its fate grows increasingly clear, it may allow Bitcoin to regain control of the news cycle.


Cole Petersen

David Ogden – Http://markethive.com/david-ogden

Billionaire Bitcoin Bull Backs Fight Against Chinese Monopoly on BTC Mining

Billionaire Bitcoin Bull Backs Fight Against Chinese Monopoly on BTC Mining

A long-time Bitcoin bull with around $2.3 billion in net worth, Peter Thiel, is a good ally to have on your side if you plan on challenging China’s dominance in the global BTC mining industry. On that count, San Francisco-based Layer1 has scored a big win by raking in millions in funding from Thiel — for the second time.

For those unfamiliar with the startup, Layer1 aims to make the United States a hotbed for environmentally-friendly Bitcoin mining.

The company’s objective is to become vertically integrated, meaning it aims to launch its own Bitcoin mining facilities in the U.S., use its own power procurement for the cause, and internally design/manufacture all mining rigs.

Worries About China’s Influence on Bitcoin’s Hashrate

China has been leading Bitcoin mining-related activities ever since the early days of the world’s first cryptocurrency. The country has the largest number of Bitcoin miners in the world — in addition to being home to some of the largest mining rig manufacturers. This has caused some serious concern among analysts and the broader community.

A 2018 report jointly prepared by the researchers at the Princeton University and Florida International University underlined that nearly three-fourth of hash power on the Bitcoin network can be traced back to Chinese-managed mining pools. The report noted that while the Chinese government does not directly control these mining pools, their managers are located in China and, therefore, are subject to the communist government’s diktats.

Echoing a similar statement, Layer1’s co-founder and chief executive, Alexander Liegl, recently wrote that Chinese control of Bitcoin’s hashrate is as much as 60 percent or higher. The U.S. accounts for only five percent of the network’s hash power.

Is it Possible to End China’s Lead in BTC Mining?

Given China’s current lead over other countries, tipping the balance outright is probably out of question — at least, for the foreseeable future. Layer1 understands that and plans on proceeding one step at a time.

The company is optimistic that, with some effort, it can help the U.S. account for 15 percent of Bitcoin’s net hashrate. The fact that Layer1 already owns electricity substations and land-property in Texas will be of great use towards accomplishing that feat.


Shilpa Lama 1 min ago

David Ogden – Http://markethive.com/david-ogden