Hodling Bitcoin Is the Best Strategy Research Shows

Hodling Bitcoin Is the Best Strategy, Research Shows

Most of Bitcoin’s upside happens on just a few days annually. HODLing is the best strategy to not miss out, according to Binance Research.

Binance Research has put out some stats on why HODLing remains a viable, if not the best, strategy in the current cryptocurrency market. This is primarily due to the fact that major market moves for Bitcoin seem to happen for just a few short days, which are easy to miss.
 

To HODL or Not to HODL, Answers Binance

As BeInCrypto previously reported, since 2013, Bitcoin has generated most of its annual performance in just ten days of the year. When the top 10 days of gains for each year since 2013 are removed, Bitcoin would actually be down -25%. So, the most important moments in Bitcoin’s history effectively happen in the blink of an eye compared to the rest of the calendar year.

Missing out on these double-digit gains can be painful, especially considering they’re so hard to foresee. This is why Binance Research suggests, based on these numbers, to HODL.

Lessons from 2007

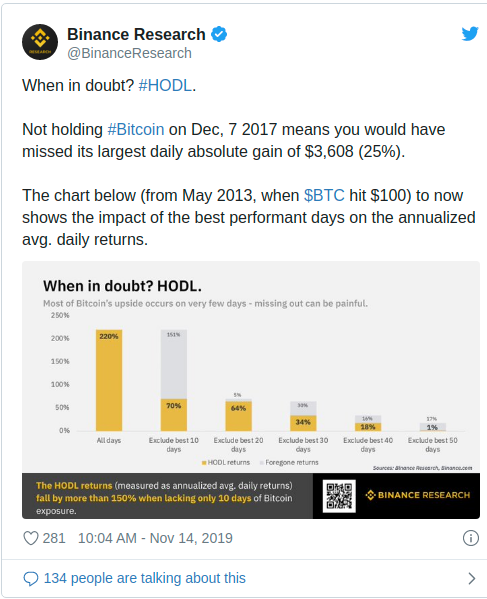
Others, however, seemed to disagree. If one had HODL’d Bitcoin since December 2017, they would still be at a loss of over -50%. As one user points out, it was far better to sell in January 2018 instead of weathering a monthly drop of -65%.

Joe007 (@J0E007) responded to Binance, stating that “HODLing is a nice meme but not exactly a rational value preservation strategy.”

Such concerns are, after all, reasonable. However, no one would argue that HODLing implies that one has to be wedded to their holdings. Instead, it simply implies a resilience, which means you won’t sell on any small downturn. The HODL strategy also works best when it begins at a smart entry point. For example, HODLing from January 2019 would undoubtedly be a smart move.

Yet, given that so many were burned in 2017, HODL has somehow taken on a negative connotation for some. Yet, one has to be mindful of the fact that we are now in the beginnings of a new market cycle. These are the times when the HODL strategy best pays off.

When the next bullish cycle comes to a head, those HODL’d profits should definitely and finally be realized. But for now, just sit tight and HODL—it’s the best strategy in this choppy market.


 Anton Lucian

David Ogden – Http://markethive.com/david-ogden

The cryptocurrency market nurses losses – Bitcoin and major altcoins dip below support levels

The cryptocurrency market nurses losses – Bitcoin and major altcoins dip below support levels

  • Bitcoin (BTC) has dropped below $8,700 during early Asian hours.

  • Altcoins follow the lead, nursing losses.

Cryptocurrency market is flashing red colors on Thursday. Bitcoin and all major altcoins are nursing losses amid growing bearish sentiments. The total cryptocurrency market capitalization is registered at $239 billion, unchanged from this time on Wednesday; the worth of the digital asset of $63 billion change hands daily on average. Bitcoin's market share settled at 66.0%.

Top-3 coins price overview

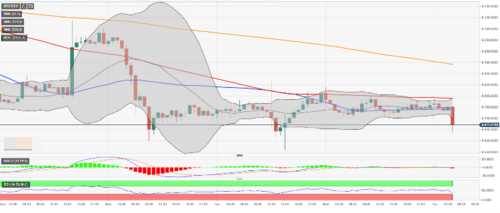
BTC/USD has stayed mostly unchanged on a day-to-day basis and lost over 1% of its value since the beginning of Thursday. At the time of writing, the coin is changing hands at $8,660, off the intraday high registered at $8,785. On the intraday charts, the sell-off gained traction after the price broke below SMA50 (Simple Moving Average) 1-hour at $8,740. The next strong support comes at $8,600 ( the lower line of the daily Bollinger Band), followed by $8,545 (SMA50 daily).

BTC/USD, 1-hour chart

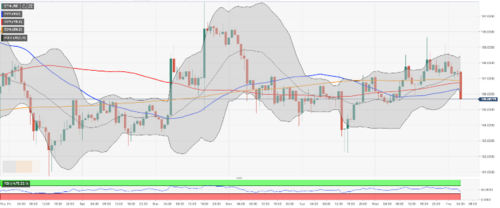
Ethereum, the second-largest digital asset with the current market capitalization of $20.2 billion, is oscillating within a range with a short-term bearish bias. The coin dropped from the Asian high of $188.66 to trade at $185.50 at the time of writing, down 1.3% since the beginning of the day. Looking technically, ETH/USD needs to recover above $186.30 (SMA50 1-hour) to mitigate thee initial bearish pressure. The next support is created by psychological $185.00.

ETH/USD, 1-hour chart

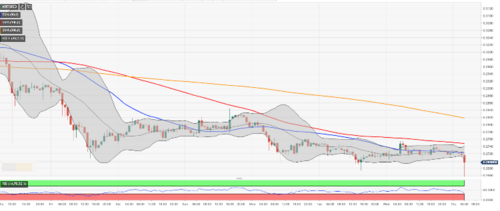
Ripple’s XRP has lost 1.0% since the beginning of Thursday to trade at $0.2695 by the time of writing. The third digital coin with the current market value of $11.6 may be vulnerable to further losses if a move below $0.2700 is confirmed. The next bearish target is seen at the current intraday low of $0.2657.

XRP/USD, 1-hour chart


Tanya Abrosimova

David Ogden – Http://markethive.com/david-ogden

Bitcoin to Outshine the SampP 500 in the Next Year

Bitcoin to Outshine the S&P 500 in the Next Year

Will the biggest cryptocurrency in the world beat the S&P 500, the Bloomberg Barclays Bond Index, and the House Pricing Index in the coming 12 months? If a survey conducted by blockchain analysis company Chainalysis is any indication, Bitcoin is all set to outdo all these asset classes in the next 12 months.

The survey conducted on a set of financial professionals revealed this rather surprising result that Bitcoin will outdo even the S&P 500, the stock market index that measures the stock performance of 500 large companies listed on stock exchanges in the United States.

Among the 350 financial professionals from prominent banks and regulatory agencies who participated in the poll, as many as 48% vouched for Bitcoin; they firmly believe that Bitcoin will outperform other investment classes like S&P 500, the Bloomberg Barclays Bond Index, and the House Pricing Index in the next year.

The survey conducted in September this year further shares more insights into cryptocurrency businesses around the world, as around 80% of surveyed financial professionals said that less than half of their retail clients transact with cryptocurrency businesses. Meanwhile, 28% of these professionals said that between 1% and 10% of their customers transact with cryptocurrency businesses, 33% of them said the number of customers that transact with cryptocurrency businesses is negligible. Moreover, 13.5% of respondents also said that they didn’t know whether any of their customers had purchased cryptocurrency.

Even though the world is now witnessing continued regulatory issues regarding the acceptance of cryptocurrencies, a large percentage of the financial professionals have expressed the view that the world will see the emergence of a global digital currency sometime within the next 5 to 10 years. And among the participants in the survey, as much as 33% believe that the US will have control over the digital currency. 21% expressed that the control will be in the hands of China.

Interestingly, while the US and the EU are presently opposing the digital currency Libra proposed by US-based social networking company Facebook, China has recently expressed its open enthusiasm for blockchain technology.

Published by Victoria Kyle at November 12, 2019

David Ogden – Http://markethive.com/david-ogden

6 Months Before Halving Signs Indicate Bitcoin Miners Are Hoarding

6 Months Before Halving Signs Indicate Bitcoin Miners Are Hoarding

The great bitcoin reward halvings are coming and many newcomers have not experienced a halving event unless they joined the crypto community prior to 2016. A few speculators believe bitcoin miners and whales are hoarding coins right now until after the adjustment so prices will be driven up. Moreover, for the first time, crypto proponents will observe how both BTC and BCH deal with the reward reduction as both networks are mined by some of the same pools.

The Reward Halving Approaches

When Satoshi released the Bitcoin protocol, one of the rules that came with the program was the fact that the block reward gets cut in half every four years (every 210,000 blocks) depending on hashrate speed. The last time digital currency fans saw a reward halving was on July 9, 2016, at block 419,975 when the BTC block reward was cut in half from 25 BTC to 12.5 BTC. At the time there were 15.7 million BTC mined into existence and roughly 1.4 exahash per second (EH/s) processed blocks on the chain. A little over a year later, the heightened scaling debate led to a hard fork on August 1, 2017, when the chain split into two factions. More than two years have passed and a slew of mining pools processing the consensus hashing algorithm SHA256 now mine on both networks.

According to current data, the Bitcoin Cash (BCH) chain will experience a reward halving on April 8, 2020.

At press time, there is 18,041,637 BTC mined into circulation and the next halving should occur in 184 days. Currently, the hashrate processing the BTC chain is around 94.48 EH/s and at this speed, the halving will occur on May 14, 2020. There are 26,668 blocks left to mine on the BTC chain before the subsidy reduction and miners will have obtained 333,350 BTC processing blocks up until this point. Miners processing the Bitcoin Cash (BCH) network are using between 2.75-4 EH/s over the course of the last week. There’s been 18,107,613 BCH mined into existence so far and 608,598 blocks recorded to-date. Data shows that the BCH chain will experience a reward halving a month earlier than BTC on April 8, 2020. At the time when the reward halves, the BCH block reward will drop from 12.5 BCH to 6.25 BCH.
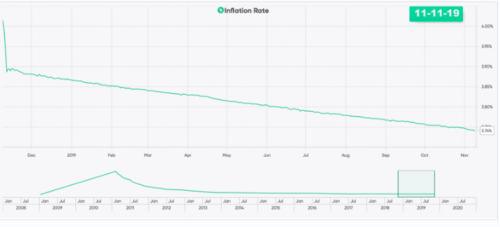
BCH inflation rate on November 11, 2019, is very close to BTC’s inflation rate at 3.74%.

Multiple Factors Will Affect the Reward Halvings

Ten days ago, Bitcoin.com published a video with professional miners from around the world who explained what they think will happen during the halving. The film included Hyperblock’s CEO Sean Walsh, Genesis Mining CEO Marco Streng, F2Pool’s Global Director Thomas Heller, and quite a few mining heavyweights. The mining industry executives mentioned topics like BTC’s inflation rate dropping lower than USD and EUR for the first time ever after the reward halving. They also discussed how the last halving was ‘priced in’ and whether or not that same trend will happen again.

“The halving is a brutal wipe-out event,” Marco Streng stressed in the film. “It knocks out immediately the miners who are not efficient enough and shows no mercy.” Statistics show that BTC’s inflation rate is at 3.85% at the time of writing, while the inflation rate for BCH is similar at 3.74%.
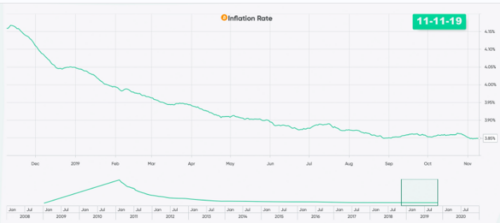
BTC inflation rate on November 11, 2019, is 3.85%. The BTC halving is estimated to occur on May 14, 2020.

There are a few metrics that also show miners and whales are likely hoarding coins before the next reward reduction. Mining data stemming from both BTC and BCH chains show that there’s been a lot more divergence between freshly generated coins and the first time they are spent onchain. Speculators believe miners will hoard coins to drive up the price so they can maintain the same revenues after the halving.
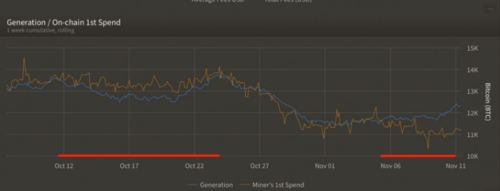
Number of BTC mined versus how many spent on 11-11-19.

The onchain market intelligence company Glassnode has shown that BTC whales are accumulating lots of coins. On October 11, Glassnode tweeted that the number of whales (BTC addresses with 1,000 BTC or more) had reached an all-time high. All of these factors are taken into consideration when discussing the theoretical events tied to the next halvings.
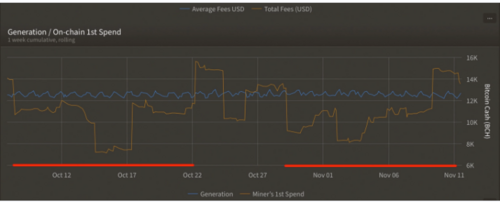
Number of BCH mined versus how many spent on 11-11-19.

The truth is no one knows exactly what will happen during the BCH and BTC reward reductions. Right now miners from both networks are chugging along processing blocks so transactions can be confirmed. There are six different pools that mine both chains including Viabtc, Antpool, Btc.com, Btc.top, Bitcoin.com, and Poolin. When both halvings occur, a lot of other metrics will affect the networks including the current price during the subsidy reduction, the difficulty on both chains, and energy costs. Some people believe that after the next halving home or hobby mining might become nonexistent and only situated pools with significant hashpower will survive.

What do you think will happen to the BCH and BTC chains after the 2020 halving? Share your thoughts in the comments section below.


by Jamie Redman

David Ogden – Http://markethive.com/david-ogden

Bitcoin BTC Price Fails to Hold Above Weekly Close 5 Mln Longs Liquidated on BitMEX

Bitcoin [BTC] Price Fails to Hold Above Weekly Close, $5 Mln Longs Liquidated on BitMEX

Bitcoin [BTC] rose $200 on Sunday as price broke above $9000. The psychological positive move along with green across the entire crypto market raises the sentiments of most traders towards the year-end.

However, it fails to hold the bullish psychological as the price has fallen back to $8950 levels. The price of Bitcoin [BTC] at 4: 30 hours UTC on 11th November 2019 is $8955.

Bitcoin Weekly Close

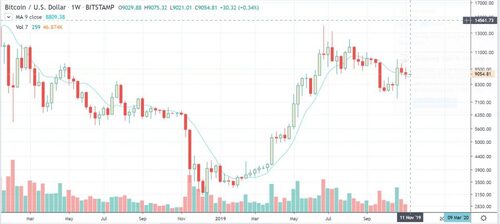
On a weekly scale, even after the positive move, BTC price closed on a red. According to Tone Vays, the weekly chart looks neutral, however, on a bearish count according to sequential analysis.

Similarly, on a daily scale as well, the 200-Day inability to break above the 200-Day Moving average brings it closer to a death cross with the 128-Day moving average.

He cites that the resistance for a bullish break-out this week out would be around $9600.

BTC/USD Weekly Chart on Bitstamp (TradingView)

Another Gap Fills on CME on the 4-Hour

The change in the price of Bitcoin over the weekend often creates a substantial gap with CME. As CME is one of the largest regulated exchanges for Bitcoin futures, it has a considerable effect on Bitcoin prices.

Moreover, with Bitcoin, it generally has a tendency to fill the price gaps with CME. The difference was about $215, as Bitcoin closed at $8885 on Friday. With the correction on Monday to about $8950 as filled most of the gap.

Moreover, the volume of the break was also not enough to justify a massive bullish breakout.

Bulls Still Scared of the Bears?

The bullish turn was accepted by the market contently as traders moved further long. Only a small percentage of short liquidations were noticed signaling a bullish inclination.

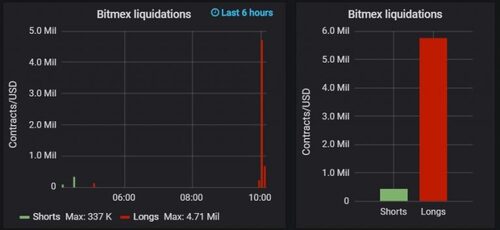
However, since Bitcoin fails to maintain the levels, about $5 million worth Bitcoin longs liquidates on BitMEX in less than 2 hours.

Bitfinex and BitMEX liquidations (Source)

Technically, Bitcoin is not out of the clutches of the bears. First and foremost, the 200-Day Moving Average continues to act as resistance and is now rising, currently at $9240.

The market sentiments are largely bullish with December futures contracts selling at $9075 and a high long/short ratio on spot exchanges. The funding rate on BitMEX and Bitcoin basis on Okex is also positive with large magnitudes signaling strong bullish inclination. However, there is still a lack of momentum at the moment.

Do you think the strong bullish inclination is justified or bears are still strong? Please share your analysis with us.


Nivesh Rustgi Bitcoin News 1 min ago

David Ogden – Http://markethive.com/david-ogden

Bitcoin BTC Price Weekly Forecast – More Downsides Likely

Bitcoin (BTC) Price Weekly Forecast – More Downsides Likely

  • After consolidating above $9,000, bitcoin declined heavily against the US Dollar.

  • The price is currently trading in a bearish zone, with a close below $9,000 and $8,920.

  • There was a break below a major contracting triangle with support near $9,180 on the 4-hours chart of the BTC/USD pair (data feed from Kraken).

  • The price is currently showing bearish signs and it could decline further towards $8,560 or $8,300.

Bitcoin price is trading in a downtrend below $9,000 against the US Dollar. BTC remains at a risk of more downsides towards $8,300 in the near term.

Bitcoin Price Weekly Analysis (BTC)

In the past few days, bitcoin consolidated in a range above the $9,000 support against the US Dollar. However, the bulls failed to protect losses, resulting in a downside break below the key $9,000 support area.

Additionally, there was a break below the 50% Fib retracement level of the upward move from the $7,317 low to $10,578 high. More importantly, there was a break below a major contracting triangle with support near $9,180 on the 4-hours chart of the BTC/USD pair.

It opened the doors for more losses below the $8,920 support and the 100 simple moving average (4-hours). The decline was strong and bitcoin even settled below the $8,800 level.

At the moment, the price is consolidating below the $9,000 and $8,900 levels. An immediate support is near the $8,600 and $8,560 levels. Moreover, the 61.8% Fib retracement level of the upward move from the $7,317 low to $10,578 high is near the $8,560 level.

If there are more downsides, the price could slide towards the $8,330 and $8,300 support levels. The mentioned $8,300 area acted as a resistance earlier and now it is likely to provide support.

Any further losses may push the price towards the $8,080 support. It represents the 76.4% Fib retracement level of the upward move from the $7,317 low to $10,578 high.

On the upside, the recent support area near the $9,000 level could act as a resistance. Besides, the 100 simple moving average (4-hours) is a major hurdle near the $9,100 level. Therefore, a successful close above $9,100 is needed for more gains in the near term.

Bitcoin Price


Looking at the chart, bitcoin price is clearly trading in a bearish zone below the $9,000 support and the 100 simple moving average (4-hours). Thus, there are high chances of more losses towards the $8,560 support or $8,300 pivot area.


Technical indicators

4 hours MACD – The MACD for BTC/USD is slowly losing pace in the bearish zone.

4 hours RSI (Relative Strength Index) – The RSI for BTC/USD is now well below the 40 level.

Major Support Level – $8,560

Major Resistance Level – $9,100


Aayush Jindal

David Ogden – Http://markethive.com/david-ogden
China Scraps Plan to Ban Crypto Mining – Bullish for Bitcoin

China Scraps Plan to Ban Crypto Mining – “Bullish for Bitcoin”

Close on the heels of Chinese President Xi Jinping’s endorsement of blockchain technology, the Chinese government has scrapped its plans to ban cryptocurrency mining. Now, Bitcoin mining will not face a state crackdown in China.

The news marks a major positive for Bitcoin-related activities in China, a country where cryptocurrency outside the control of the central bank remains all but banned. This somersault in the Chinese government’s policy on cryptocurrency is quite interesting as China has for long been known as a somewhat anti-Bitcoin country. It has made countless efforts to throw off the Bitcoin community in the country, even going as far as banning mining and other crypto-related activities.

However, things seem to be changing slowly as the country seems to not just be in support of blockchain technology, but has also decided that it will not frustrate the Bitcoin mining industry.

Some months ago, the China National Development and Reform Commission (NDRC) proposed a list of industries in the country that should be disallowed from continuing its regular activities and on that list at the time, Bitcoin mining was included. Now, about 6 months later, the newly published Industrial Structure Adjustment Guidance Catalog from the NDRC, conspicuously omits crypto mining.

Interestingly, the latest news on cryptocurrency news comes after China’s President Xi Jinping publicly declared support for blockchain technology, urging the general public to embrace the technology and all that it offers. Ever since the president’s endorsement, China has been come a lot more pro-blockchain and has published lists of hundreds of registered blockchain projects in the country.

Furthermore, the country has also concluded a new cryptography law which is expected to take effect from January 2020. The law will monitor and guide the growth of the sector in the country, but also make sure that no blockchain project gets in the way of national security or ever threatens the sovereignty or power of the state.

China has been developing its own Central Bank Digital Currency (CBDC) and is set to release it to the public. Although no launch date has been publicized so far, China will very likely be the first country to float its digital currency.


Published by Victoria Kyle at November 7, 2019

David Ogden – Http://markethive.com/david-ogden

Bitcoin And Crypto Market Cap Eye Next Break – BCH XLM EOS TRX Analysis

Bitcoin And Crypto Market Cap Eye Next Break – BCH, XLM, EOS, TRX Analysis

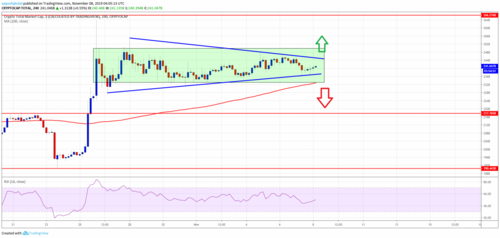
  • The total crypto market cap is currently consolidating in a range above the $232.0B support area.

  • Bitcoin price is holding the $9,200 support area, but it is also facing hurdles near $9,400.

  • BCH price is currently correcting lower after it failed to break the $300 resistance.

  • EOS price is consolidating near $3.500 and it could correct lower towards $3.400.

  • Stellar (XLM) price is climbing higher once again and it might test the $0.0800 resistance.

  • Tron (TRX) price is facing a strong resistance near the $0.0200 zone.

Bitcoin (BTC) and the crypto market cap are approaching the next key break. Ethereum (ETH), BCH, stellar (XLM), ADA, EOS, ripple, and tron (TRX) are correcting lower.

Bitcoin Cash Price Analysis

Recently, BCH price climbed higher above the $295 level against the US Dollar. The price tested the $305 resistance area, where it faced a strong selling interest. As a result, the price started a downside correction below the $300 and $295 level.

On the downside, the key support is near the $285 and $280 levels. If there are more downsides, the price could test the $265 support area.

Stellar (XLM), EOS and Tron (TRX) Price Analysis

EOS price struggled near the $3.700 resistance area. As a result, there was a downside correction below the $3.650 level. The price is currently consolidating near $3.500 and it seems like it could correct lower further towards the $3.400 support area. On the upside, the main hurdles are near the $3.650 and $3.700 levels.

Stellar price corrected gains after a sharp rally towards the $0.0880 resistance area. XLM price declined and tested the $0.0700 support area. It is once again moving higher towards the $0.0800 resistance. If there are more upsides, the price may perhaps test the $0.0820 level.

Tron price struggled to stay above the $0.0200 support area and recently corrected lower. TRX price tested the $0.0195 support and it is currently consolidating in a tiny range. If there is an upside break above $0.0200, the price is likely to resume its upward move.

Crypto Market Cap

Looking at the total cryptocurrency market cap 4-hours chart, the $250.0B resistance zone acted as a crucial barrier for more upsides. As a result, the market cap declined and it is now consolidating in a range above the $232.0B support area. If there is a downside break, the market cap could retest the $215.0B support.

Conversely, an upside break above the $250.0B resistance is likely to spark a strong rise in bitcoin, Ethereum, EOS, ripple, litecoin, bitcoin cash, XLM, TRX, BNB, WAN, WTC, ICX, and other altcoins in the near term.


Aayush Jindal

David Ogden – Http://markethive.com/david-ogden

Bitcoin price prediction – Why 9600 must be brought down for BTCUSD rise to 10000? Confluence Detector

Bitcoin price prediction – Why $9,600 must be brought down for BTC/USD rise to $10,000? – Confluence Detector

  • Bitcoin forms a narrow range within a wider range making recovery a hard nut to crack.

  • The limited support means that declines will have far-reaching effects.

  • The most prominent resistance at $9,353 must be broken for gains towards $10,000.

  • The mundane trading activity is still at its best even as the week’s trading nears its end. Bitcoin is still trading within a wide range between $9,000 and $9,600. Moreover, the trend in the last two days has seen the crypto form a new narrow range between the wider range, $9,300 – $9,500. Meanwhile, the prevailing trend has an inclination towards the lower range limits leaving levels towards $9,600 in bearish dominance.

Bitcoin price confluence levels

Resistance and support levels are important indicators for traders as well as investors. FXStreet’s Confluence Detector tool assists in grouping indicators that form solid resistance and support zones. For instance, Bitcoin is trading at $9,297 after correcting from an intraday high of $9,353. Advances made above $9,300 will come face to face with acute selling resistance at $9,353. This is the most prominent resistance zone and is home to the previous high 15-minutes, previous high 1-hour, Bollinger Band 4-hour middle, SMA 50 1-hour BB 15-mins upper and Fibo 38.2% 1-day among others.

If the bulls manage to clear this level before the weekend, then we are looking at Bitcoin trading above $9,740 (next resistance target) before Monday next week.

On the other hand, initial support is highlighted at $9,256. The indicators converging here are the SMA 50 4-hour, pivot point one-day support one, SMA 200 1-hour and previous low one-day. Bitcoin has limited support areas, therefore focus should be put on scaling the levels towards $10,000.


John Isige

FXStreet

David Ogden – Http://markethive.com/david-ogden
Bitcoin And Crypto Market Could Rise Steadily – BCH Tron XLM ADA Analysis

Bitcoin And Crypto Market Could Rise Steadily – BCH, Tron, XLM, ADA Analysis

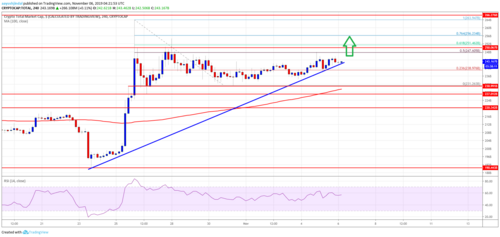
  • The total crypto market cap is holding a key support near the $240.0B and $238.0B levels.

  • Stellar (XLM) price surged in the past few days and settled above the $0.0800 resistance.

  • Bitcoin cash price is up more than 2% and it is approaching the $300 resistance area.

  • Tron (TRX) price is currently correcting lower and it is approaching the $0.0195 support.

  • Cardano (ADA) price is slowly rising and it could soon test the $0.0460 and $0.0475 resistances.

The crypto market cap and bitcoin (BTC) are rising steadily. Ethereum, BCH, ripple, stellar (XLM), EOS, TRX, and cardano (ADA) might climb higher.


Bitcoin Cash Price Analysis

After a downside correction, BCH price found support near the $280 and $285 levels against the US Dollar. The price is now moving higher and it is trading above the $295 level. It seems like it could soon surpass the $300 resistance and climb towards the $320 level in the near term.

On the downside, an initial support is near the $292 level. However, the main support for the bulls is near the $285 and $280 levels.

Stellar (XLM), Tron (TRX) and ADA Price Analysis

Stellar price rallied in the past few days and surged above the $0.0720 and $0.0750 resistance levels. XLM price even settled above the $0.0800 resistance and it is currently consolidating gains. An initial support is near the $0.0805, followed by the main $0.0800 level. On the upside, the key resistances are near the $0.0820 and $0.0832 levels.

Tron price is currently correcting lower and it recently traded below the $0.0200 support. TRX price may soon test the $0.0195 support area, where the bulls are likely to take a stand. On the upside, a clear break above the $0.0205 resistance might push the price towards the $0.0220 level.

Cardano price is holding gains above the $0.0420 level and it is slowly climbing higher. An initial resistance is near the $0.0445 and $0.0450 levels, above which ADA price could accelerate gains towards the $0.0475 level. On the downside, there are supports near $0.0420 and $0.0412.

Crypto Market Cap


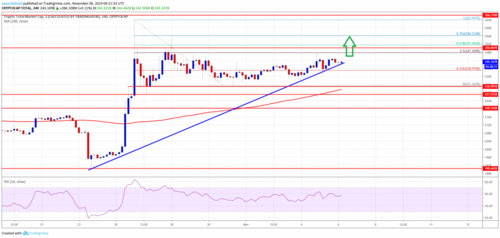
Looking at the total cryptocurrency market cap 4-hours chart, there are positive signs above the $240.0B and $238.0B support levels. There is also a connecting bullish trend line forming with support near the $240.0B level. Therefore, a downside break below the $238.0B level could push the market cap back towards the $230.0B support area.

If not, there are chances of more gains in bitcoin, Ethereum, EOS, stellar, LTC, ADA, EOS, ripple, TRX and other altcoins in the near term. On the upside, the main hurdles for the crypto market cap are near $250.0B and $255.0B.


Aayush Jindal

David Ogden – Http://markethive.com/david-ogden