Bitcoin Teeters on 10K But Can It Fend Off Another Bear?

Bitcoin Teeters on $10K, But Can It Fend Off Another Bear?

Bitcoin’s recent market movements have thrown into contention consensus about its short-term price direction, with traders asking openly if demand is strong enough to fend off another bear market.

Such a question has emerged in the wake of the world’s largest cryptocurrency’s inability to set new highs above those seen in June and July, when optimism about a Facebook cryptocurrency launch pushed the price of bitcoin to $13,880 and $13,200 on June 26 and July 10, respectively.

Since then, bitcoin has largely failed to test these highs again, prompting speculation traders may be willing to push the market into a lower range, one that could be deepened by available futures options.

However, investors and analysts remain bullish based on the assumption that demand will continue its current course, helping to sustain prices around $10,000 until next year’s May halving takes effect. Then, investors will see the amount of new bitcoin introduced to the market daily cut in half, with each new block in the blockchain producing 6.25 BTC, down from 12.5 BTC.

As can be seen by the recent litecoin halving, events that increase the perceived scarcity of cryptocurrencies have proven to catalyze buying interest.

Further, Jeff Dorman, chief investment officer at Arca, an investment management firm focused on the asset class, argues that with the likes of Bakkt and Fidelity opening their doors to new money amid current global economic tensions, bitcoin looks attractive to large hedge fund managers seeking to offset risk in traditional markets.

Dorman told CoinDesk:

“Most macro hedge funds are contemplating using BTC as a better way to offset the systemic risks that are building globally. There seems to be too much interest and too much money on the sidelines for the market to really go lower in any meaningful way.”

Factoring Miner Demand

Analyzing the cryptocurrency markets remains an evolving science, but new metrics suggest that bitcoin may currently be priced favorably ahead of the halving event.

The Diffiulty Ribbon, created by influential market analyst Willy Woo, for example, was recently released. It helps illustrate how leading analysts believe miner selling pressure affects the price of bitcoin.

(As miners are believed to sell the BTC they receive from winning block rewards – to pay employees, electrical bills and other real-world costs – they are believed to influence market direction.)

The above chart shows bitcoin’s “network difficulty,” a function of how hard the software makes it to discover a new block and thus claim the new cryptocurrency it releases to the market.

When the rate of network difficulty increases slows, analysts believe this is a sign miners are shutting off their hardware (leaving only the strong miners who proportionally need to sell fewer coins to remain operational). It’s believed this leads to reduced sell pressure and more room for price increases.

The ribbon consists of simple moving averages of BTC network difficulty so the rate of change of difficulty can be easily seen. According to Woo, the best times to buy BTC are zones where the ribbon compresses.

He said:

“The timing of the last difficulty ribbon compression is very bullish, especially given we expect another compression at the halving, I don’t think we have time to come into a bear season before then.”

Holding $10K

That said, less sophisticated investors may be using simple price charts to gauge entries.

The last two months have produced a series of lower highs putting a clamp to further growth. This can be observed in the amount of sell pressure bitcoin has seen when approaching upper resistances $10,800-$13,200.

Still, prices have held above $10,000 by the end of each daily closing period for nearly 30 days, suggesting that demand for bitcoin below that mark remains strong. As a result, some analysts believe BTC’s outlook would only change bias from bullish-to-bearish long-term should a firm close below $7,333 (200-day moving average) occur.

Still, the pressure is now mounting on the bulls to produce something significant in the short-term or else risk exposing lower supports at $9,600.

Whether or not short-term price action remains bearish, analysts agree that BTC is still bullishly bid based on its position above the aforementioned 200-daily moving average and current mining activity.

However, Dorman argues simple psychology may be the overriding factor so long as $10,000 remains a strong support and belief in the halving as a price catalyst remains strong.

He concluded:

“In general, across any asset class, when consensus is to buy lower… you rarely get that chance.”


Sebastian Sinclair

Aug 28, 2019 at 04:00 UTC


David Ogden – Http://markethive.com/david-ogden

Would bullish divergence keep Bitcoin price above 10000?

Would bullish divergence keep Bitcoin price above $10000?

Another week comes to pass as Bitcoin price hovers at the ten thousand dollars ($10,000) mark and past twenty-four hours (24hrs) have been no different than the price action across the week. Bitcoin (BTC) price plunged down to the low point of nine thousand seven hundred and sixty-eight dollars ($9768.06) mark at one point while the highest point was recorded at the ten thousand four hundred dollars ($10400) mark. Whereas the weekly high is recorded at the ten thousand nine hundred and twenty-nine ($10929) dollars on the 20th of August but the price has not been near that point since. Bitcoin is trading at ten thousand one hundred and three dollars ($10103.25) at the time of writing.


Bitcoin price – Bearish divergence Cryptocurrency analyst and trading expert BitFink revealed that a bearish divergence can be seen on the Bitcoin cryptocurrency charts. The idea is simple and so far it has been keeping the BTC price afloat above the ten thousand dollars ($10,000) mark.

BitFink is of the view that short bearish divergences in the BTC price action are what keep the Bitcoin price above the psychological limit of ten thousand dollars ($10,000). However, as evident in the chart above, if the Bitcoin price action falls into a corrective action the price is ready to fall down to the nine-thousand seven hundred and fifty-nine dollars ($9759) mark.

Below that point is the twenty (20) day low standing at the nine thousand four hundred and seventy dollars ($9470) mark. On the other hand, twenty (20) day exponential moving average (EMA) stands at the ten thousand and thirty-three dollars ($10,033) mark. This is the point where the BTC price has been finding support over the weekend. The weekend is still young and the BTC price can sway in any direction. Let’s see where the dust settles as the weekend comes to an end


By Saad B. MurtazaAUG 25, 2019

David Ogden – Http://markethive.com/david-ogden
Bitcoin (BTC) Bear Market Isn’t Over? Industry Analysts Duke It Out


Bitcoin (BTC) Bear Market Isn’t Over? Industry Analysts Duke It Out


Bitcoin Could See Another Drop

With Bitcoin (BTC) recently surmounting $5,000 in a move that came straight out of left field, some are sure that bears are done. Jonathan, a forex and cryptocurrency trader, however, recently explained that it would be unfair to assume that the bear market is over. In fact, in a recent Twitter post, he seemed to hint that proclaiming a bear trend over is irresponsible.

He recently explained that this same cycle of optimists calling for an end to the bear after a short-term, emotion-inducing spike always ended in disaster, looking to Bitcoin’s bear market rallies throughout 2018. Past performance isn’t indicative of future action, but considering the reliability of short-term upticks resulting in an eventual move to fresh lows, Johnathan might have a point. Certain technical indicators, too, could also be hinting that a move lower is inbound.

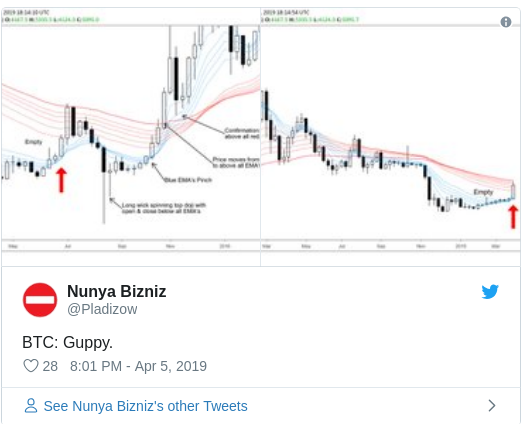
Nunya Bizniz recently wrote on Twitter that the last time Bitcoin’s one-week Guppy, a technical indicator that weighs moving averages to predict price trends, looked as it is now, BTC rallied into the top of its range, before a final capitulation event, which brought the cryptocurrency lower than the seeming bottom. Thus, if history repeats, BTC will move to as high as $5,600 in the coming weeks, before a rapid sell-off that brings the asset under $3,000 for mere days.

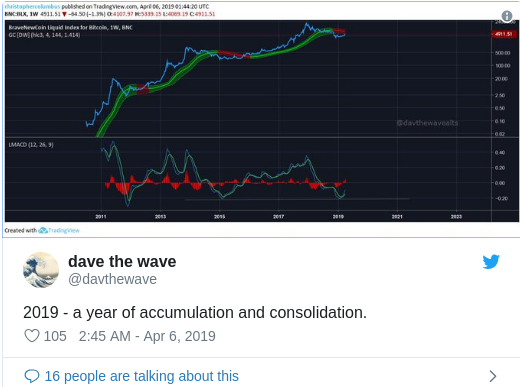
Even if there are unlikely to be fresh lows, many analysts are adamant that a return to all-time highs won’t occur until 2020 at the earliest. Dave The Wave, an analyst who favors the MACD indicator, recently posted the chart below on Twitter. While little was divulged, other than “2019 — a year of accumulation and consolidation,” the chart implies that if history repeats itself, Bitcoin could trade relatively flat over much of 2019, eventually rallying into 2020’s block reward reduction.

Magic Poop Cannon, a technical analyst that has been tacitly endorsed by Tom Lee, recently made a similar comment. Per previous reports from this outlet, the trader believes that Bitcoin will trade between $3,200 and the “low 4,000s” for much of the year.

Maybe “Crypto Winter” Is Over

The aforementioned sure seem to be making the case that the cryptocurrency downturn isn’t over yet, but some analysts have begged to differ. As reported by Ethereum World News earlier today, Tom Lee, revealed that he thinks the worse may be over for BTC.

Fundstrat’s in-house crypto bull remarked that Bitcoin’s sudden spike last Monday was based on “true buying,” making it not an act of manipulation as some postulated. This is likely in reference to a Reuters report, which claimed that a single group or entity managed to purchase $100 million worth of Bitcoin across three exchanges, creating a short-term influx of FOMO that pushed BTC higher.
 

Furthering the bullish narrative, Lee looks to the 200-day moving average, which has acted as an overarching level of resistance for BTC since early-2018. The Fundstrat co-founder explains that while many proclaimed cryptocurrencies dead as a result of their -85% performance from top to bottom, BTC closing and holding above the aforementioned level confirms that it is “back in a bull trend.”
 

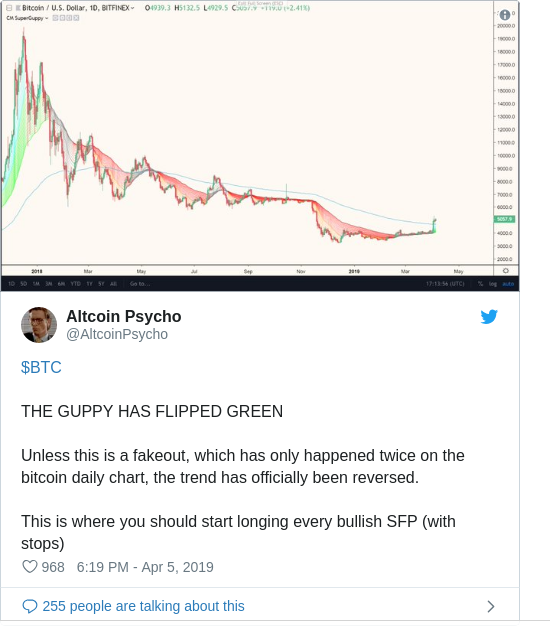
Technicals, too, could also show that Bitcoin’s downturn has likely bitten the dust. According to analyst Altcoin Pyscho, the Guppy has “flipped green” on the one-day Bitcoin chart on BitMEX.

While there’s a fleeting chance that this shift in the Guppy is a bull trap or “fakeout,” which has purportedly only occurred twice in BTC’s history, Pyscho asserts that the bear trend has likely been reversed. He adds:

This is where you start longing every bullish swing failure pattern (with stops).”


By Nick Chong April 7, 2019

Bitcoin (BTC) Bear Market Isn't Over? Industry Analysts Duke It Out

David Ogden – Http://markethive.com/david-ogden
Bitcoin (BTC) Long Term Price Forecast- February 16

Bitcoin (BTC) Long Term Price Forecast- February 16

Bitcoin (BTC) Long Term Price Forecast- February 16
 

BTC/USD Long-term Trend: Bearish

  • Resistance levels: $7,200, $7,400, $7,600

  • Support levels: $3,500, $3,300, $3,100

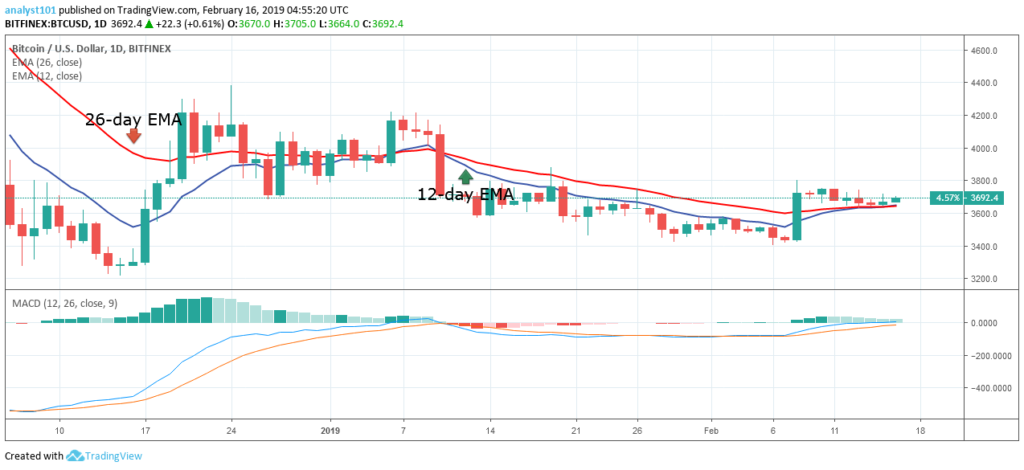
Last month, January, the BTC/USD pair was trading in the bearish trend zone. With an opening balance of $3,832.60, the BTC price depreciated to the low of $3,503.80. In other words, in January, the crypto lost about 8.57% of its capitalization. In January the bears broke the $3,700 support level as price continued its fall to the $3,400 price level.

The broken support level of $3,700 is now a resistance level for the BTC price. On February 8, the cryptocurrency came out of the bearish trend zone as the bulls broke the 12-day EMA and the 26-day EMA. The crypto’s price reached a high of $3,800 but closed at a price of $3,724.The crypto is facing resistance at the $3,700 and $3,800 price levels. Currently, the BTC price is retracing from the recent high and has fallen to the support of the EMAs. If the price is sustained above the EMAs, the crypto is likely to resume its bullish trend. Meanwhile, the MACD line and the signal line are below the zero line which indicates a sell signal. The crypto’s price is above the 12-day EMA and the 26-day EMA which indicates that price is likely to rise.


By Azeez M – February 16, 2019

David Ogden – Http://markethive.com/david-ogden
Bitcoin (BTC) Transaction Count Has Crypto Community Bullish

Bitcoin (BTC) Transaction Count Has Crypto Community Bullish

Bitcoin (BTC) Transaction Count Has Crypto Community Bullish

Bitcoin Transaction Counts On The Up-And-Up

Although Bitcoin (BTC) has continued to struggle in recent weeks, posting harrowing losses day-in, day-out, there are some optimists that are adamant that investors shouldn’t be alarmed.

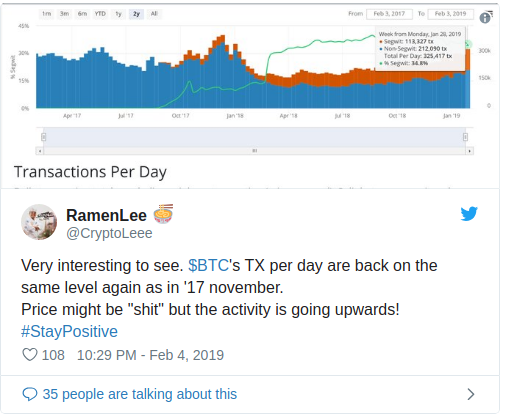
Case in point, Ramen Lee, a crypto designer, recently took to Twitter to note that the number of BTC transactions per day has risen to the same levels seen in November 2017, when the digital asset boom was posting new all-time highs day-over-day.

As put by Ramen, the “price may be ‘s*it’, but the activity is going upwards.” This only underscores the ever-swelling fundamentals of the Bitcoin network.

Per previous reports from Ethereum World News, data compiled by Jameson Lopp, the chief technology officer of Casa, accentuated that from a fundamental perspective, 2018 was Bitcoin’s best year yet. Hashrate doubled, while a cumulative $410 billion in value was transacted on the “world’s most secure transactional settlement layer.” Bitcoin’s scaling solutions also saw notable levels of adoption. SegWit, a short-term, ‘bandaid-esque’ solution that squeezes more transactions into blocks, saw use swell from 10% to 40% over 2018. The Lightning Network, a long-term scaling solution that takes advantage of off-chain ledgers to facilitate effectively free, low cost, scalable, immutable, and private transactions, swelled to 500+ BTC capacity.

The Other Side Of The Coin

Although the swelling transaction count is evidently a sign that should spark optimism, there are other indicators that accentuate that the crypto community should be concerned. Murad Mahmudov, a leading Bitcoin trader with hopes of launching a crypto hedge fund, recently took to Twitter to touch on social metrics, and how they show that interest in the flagship cryptocurrency just isn’t present.

Mahmudov, who is a long-term believer in the potency of this asset class, divulged that as per BitInfo, tweets regarding the flagship cryptocurrency have reached 2014 levels, lower than any point in 2016.

Explaining the importance of this statistic, Mahmudov remarked that it’s almost as if “nothing has changed,” adding that this is an “absolute disaster for the price in the medium-term.” He noted that this accentuates how there are “far fewer people who care about decentralized, sovereign, uninflatable currency” than it may seem from the surface, and how little effect 2017’s parabolic run-up had on this community’s size.

In fact, Mahmudov quipped that more than 99% of all humans on Earth, whether poor, rich or from any other socioeconomic background, don’t care about the values that Bitcoin’s raison d’etre exemplifies. And as such, Bitcoin’s popularity boils down to its potential as a speculative asset, rather than libertarian, anarcho-capitalist, or cypherpunk ideologies. And as such, he concluded that this bear market could last longer than many may expect, with BTC potentially even falling to $1,700 apiece.
 

Chris Burniske, a partner at the blockchain-focused Placeholder Ventures and the co-author of “Cryptoassets,” noted that the mainstream “has almost entirely forgotten about Bitcoin again.” Gone are the days that “Bitcoin” was a popular word at the dinner table, as mainstream media outlets, the CNBC Fast Money segment, in particular, have slowed their coverage to a near-halt. Burniske touched on this, noting that via “conversations with people from home,” the crypto boom is still tangible in their minds, but the subsequent bust wasn’t observed.

But, while there seem to be few active industry participants quipping about Bitcoin on Twitter, some would argue that the cryptocurrency has reached mainstream adoption. Alistair Milne, the chief investment officer of the Digital Currency Fund, recently explained that millions, if not billions across the globe has heard the word “Bitcoin” in some context. And as such, when FOMO kicks in, for both institutions and retail investors alike, buying pressure is likely going to be stronger than ever.


Nick Chong February 5, 2019 in Bitcoin News, Crypto Analysis

David Ogden – Http://markethive.com/david-ogden

Bitcoin Is Now Officially In Its Longest Bear Market Ever


Bitcoin Is Now Officially In Its Longest Bear Market Ever

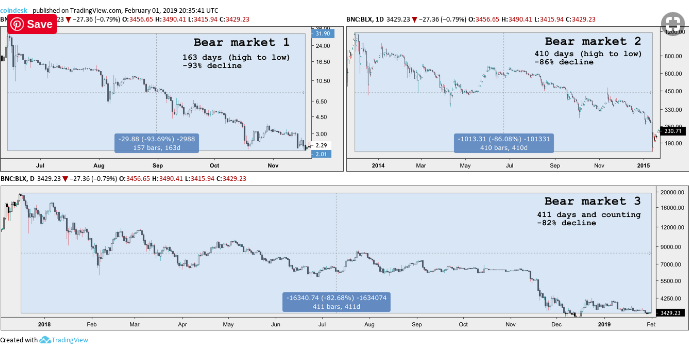
Bitcoin has officially entered the longest stretch of declining prices in its 10-year history.

The world’s oldest and most valuable cryptocurrency achieved an all-time high of $19,764 on Dec. 17, 2017 on the CoinDesk Bitcoin Price Index and has printed a series of lower price highs ever since, making February 2 (as per UTC time), the 411th consecutive day prices have been in decline.

As such, bitcoin’s latest stretch surpasses the duration of the infamous 2013-2015 bitcoin bear market, which spanned 410 days from its price high to low.

Bitcoin’s Historical Price Declines

Indeed, bitcoin’s most recent stretch of declining prices is the longest in duration ever witnessed by the cryptocurrency, but it has yet to become the worst in terms of total depreciation.

As can be seen in the chart above, bitcoin’s first significant bear market in 2011 spanned just 163 days but remains the worst performer to date.

From its price high of $31.50 to $2.01 low, bitcoin’s price fell slightly more than 93 percent, which is a steeper drop than the subsequent 2013-15 bear market when prices fell 86 percent from the previous high. The current bear market still has yet to exceed a depreciation of more than 84 percent from its all-time high, while its current prices near $3,400 register an 82 percent decline.

No one can be certain if or when bitcoin’s record decline will come to an end, but whether it be the market’s subdued response to the withdrawal of a highly anticipated bitcoin exchange-traded fund (ETF) proposal or bitcoin’s next deflationary halving event slowly approaching, it does seem evidence is beginning to mount for a bitcoin bottom occurring in the not too distant future.

Weekly chart and halving history

As part of bitcoin’s deflationary monetary policy, the rewards per mined block get cut in half every four years or 210,000 blocks, as a result slowing the creation of new bitcoins.

The event is now known as a “halving” and has long been considered a bullish catalyst for bitcoin’s price since the existing or growing demand for the cryptocurrency is likely to outweigh the slowing production of supply. Simply put, since demand is greater than supply, it creates a higher valuation for the underlying asset, regardless of the market.

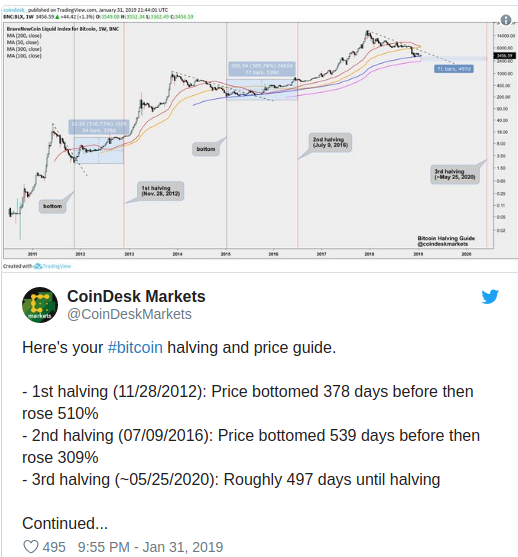
As the tweet below from CoinDesk Markets shows, bitcoin’s price trend tends to bottom out and rise substantially several months in advance of the actual halving date.

While the sample size is small, bitcoin’s price finding a floor 378 days before the 2012 halving and 539 days before the 2016 halving creates an average “bottom” date of 458 days or one-and-a-quarter years before an actual halving event

With the next halving likely to occur in late May of 2020, bitcoin is now just under 500 days away, so a potential bear market ending bottom date may not be too far off if investors preemptively price in the deflation of supply like they have in the past.

Coin News Telegraph

02/02/2019

David Ogden – Http://markethive.com/david-ogden

Bitcoin (BTC) Price Analysis – Bears Push for Wedge Break

Bitcoin (BTC) Price Analysis -  Bears Push for Wedge Break

Bitcoin (BTC) Price Analysis – Bears Push for Wedge Break

Bitcoin recently broke below its falling wedge consolidation to signal that selling pressure is picking up.

Bitcoin broke below its falling wedge consolidation pattern to signal that bearish momentum is picking up. However, price seems to be stalling at the $3,300 level so a pull back to the broken areas of interest may be in order.

Applying the Fib retracement tool on the latest swing high and low shows that the 50% level lines up with the broken wedge support which might be enough to keep gains in check on a correction. The 61.8% Fib is back inside the wedge but might still serve as resistance since it’s close to the 100 SMA dynamic inflection point.

On the subject of moving averages, the 100 SMA is below the longer-term 200 SMA to indicate that the path of least resistance is to the downside. In other words, the sell off is more likely to resume than to reverse. In addition, the gap between the moving averages is widening to reflect increased selling momentum.

RSI is already indicating oversold conditions, though, and turning higher could show that buyers might be ready to take over. Stochastic is heading south but is also in the oversold region to signal that sellers are feeling exhausted.

Bitcoin seems to have gotten another blow from the SEC announcement to once again delay their ruling on the bitcoin ETF. Although there were already hints earlier from SEC Chairperson Clayton that they’re not likely to approve the proposed rule change anytime soon, the actual decision still seemed to inspire a wave of selling.

However, it’s also important to note that this decision comes after a meeting with representatives from VanEck and SolidX on how ETFs on gold and other commodities may be comparable to the one they’re proposing on bitcoin. In fact, the companies pointed out that bitcoin ETFs may be less prone to market manipulation, so the decision to delay instead of completely reject might prove to be a positive development.


Rachel Lee by Rachel Lee December 7, 2018 in Bitcoin Price Analysis

David Ogden – Http://markethive.com/david-ogden
Bitcoin going to $1500- Bloomberg Analyst

Bitcoin going to $1500- Bloomberg Analyst

Bitcoin going to $1500- Bloomberg Analyst

Mike McGlone, a Bloomberg intelligence analyst has predicted that bitcoin is possibly going to fall to $1500 soon. Bitcoin price fell down yesterday up to $3668 which is quite near the yearly low of $3522 that was achieved just a few days back on November 26. Bitcoin remained stable above $3900 for a few days but could not hold on to the selling pressure and crashed hard yesterday and may soon test the $3500 support yet again.


Bloomberg Report

Bitcoin price started its crash in May this year while trading above $9000 and falling to $6500 in July due to massive selling in just a matter of two months.

According to the report published by Bloomberg intelligence analyst, bitcoin and other prominent cryptos will likely fall and bitcoin can turn up to $1500 soon. The price of bitcoin has fallen more than 80% from the last December when it was trading around $19500. According to Mike, the price would fall around 60% from the current price.

Mike also mentioned that there is quite little to stop the price of bitcoin to fall to $1500, the reason starting from bitcoin cash hard fork and year-end tax purposes, and many other matters.

The cryptocurrency market has experienced a huge amount of selling in the month of November which resulted in billions being washed off from the crypto market. Mike mentioned that the market is currently reversing the rise of 2017.


Crackdown by SEC

The SEC is continuously engaged in cracking down the cryptocurrency space. In November, SEC had imposed huge fines on two companies that did not register their ICO as securities with the SEC. Cryptocurrency investors have been waiting for the approval of Bitcoin ETF from a long time but according to last week’s statement of SEC’s head, there is still an absence of investor protection in the crypto space, therefore the approval of Bitcoin ETF will not be done anytime soon.


Market Crash

The market crash of November this year has been the worst crash since 2011. According to Mike, lower prices help to reduce volatility in the market. Mike also mentioned that the current price drop is somewhat positive as due to lower prices there is lower volatility, less speculation, and the preponderance of stable coins.

Other cryptocurrency analysts also predict a drop in prices but higher than $1500. Some are predicting $2500 to be the lowest price while other predict $3000. On the other side, Tom Lee, the bitcoin bull is still predicting $15000 price at the end of this month.


Published 44 mins ago on December 5, 2018 By Layla Harding Mike McGlone,


David Ogden – Http://markethive.com/david-ogden

Bitcoin Price Weekly Analysis: BTC/USD Nosedives Below $3,800

Bitcoin Price Weekly Analysis: BTC/USD Nosedives Below $3,800

Bitcoin Price Weekly Analysis: BTC/USD Nosedives Below $3,800

Key Points

  • Bitcoin price fell significantly and traded below $4,000 and $3,800 against the US Dollar.

  • There is a major bearish trend line formed with resistance at $4,200 on the 4-hours chart of the BTC/USD pair (data feed from Kraken).

  • The pair is under pressure below $3,800 and it could even break the $3,500 support level.

Bitcoin price tumbled more than 15% and broke the $3,800 support against the US Dollar. BTC/USD could accelerate declines towards the $3,500 level.
 

Bitcoin Price Analysis

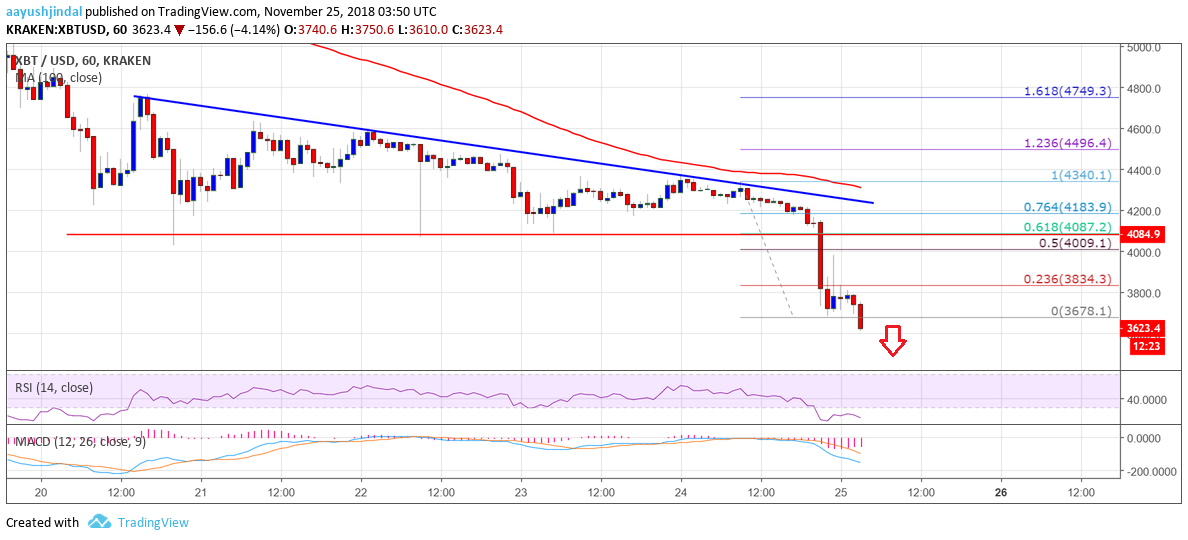
This past week, there was a tiny upside correction above the $4,300 level in bitcoin price against the US Dollar. However, the BTC/USD pair failed to gain traction above the $4,400 and $4,500 resistances. As a result, there was a sharp downside move and the price declined below the $4,000 support. The price declined more than 12% and it is currently trading well below $3,800 and 100 simple moving average (4-hours).

A new yearly low was formed at $3,620 and it seems like the current decline is not over. The last swing low was at $3,678 before the price started an upside correction. It moved above the 23.6% Fib retracement level of the recent decline from the $4,340 high to $3,678 low. However, the upside move was capped by the $4,000 level. The price was also rejected near the 50% Fib retracement level of the recent decline from the $4,340 high to $3,678 low. Finally, the price declined again and broke the $3,678 swing low. A new low was formed below $3,650 and it seems like there could be more losses. The next key support is near $3,500, below which the price could test $3,200.

Looking at the chart, BTC price is facing a lot of selling pressure below the $4,000 and $3,800 level. If there is an upside correction, the price could face sellers near $4,000.

Looking at the technical indicators:

4-hours MACD – The MACD for BTC/USD is placed heavily in the bearish zone.

4-hours RSI (Relative Strength Index) – The RSI is currently well below the 20 level.

Major Support Level – $3,500

Major Resistance Level – $4,000


AAYUSH JINDAL | NOVEMBER 25, 2018 | 5:28 AM

David Ogden – Http://markethive.com/david-ogden

There Is No ‘Bitcoin’ – What the SEC Doesn’t Get About Cryptocurrency

There Is No ‘Bitcoin' - What the SEC Doesn't Get About Cryptocurrency

There Is No ‘Bitcoin’ – What the SEC Doesn’t Get About Cryptocurrency

The U.S. Securities and Exchange Commission (SEC) has been gone to significant lengths in an attempt to understand the crypto asset space. This effort is to be applauded. However, the SEC has failed to come to terms with one fundamental aspect of crypto assets and systems.

Namely, properly constructed crypto systems do not involve “persons” or “entities” and do not represent a form of property. For this reason, they do not have any analogue in the traditional financial world, nor can they fall under financial regulation.

In the traditional financial world, assets are a claim on a specific property. For example, a commodity, shares in a company or a debt owed.

Crypto assets, however, are not a claim on anything. What is bitcoin a claim to? Or ether?

Instead, crypto assets are a form of proof. They are cryptographic proof that a specific set of mathematical functions has been performed. They are proof that certain software instructions have been performed and of the algorithmic outputs of that software. And crucially, the mathematical functions are performed by nobody in particular, they are performed by the network as a whole.

Property is “ownership determined by law.” Crypto assets are not property because they are not determined by law – they are determined by maths. This presents some obvious issues when it comes to figuring out exactly how to regulate them.

There is no bitcoin

Many people today speak of cryptocurrencies in the shorthand of property. They say things like “Alice transferred a bitcoin to Bob,” but we shouldn’t let this metaphor confuse us.

In actual fact, there was no bitcoin that existed anywhere and it didn’t move from any one place to another.

In “The Matrix,” Neo understood the true nature of the world when he understood that “there is no spoon.” Likewise, we can only understand the true nature of blockchain when we recognize that “there is no bitcoin.”

Instead, what really happened is that Alice proved to Bob that she had certain secret knowledge and that she had used that knowledge to perform a mathematical operation. But wait, the rabbit hole goes even deeper.

Even “Alice” and “Bob” are misleading fictions. Alice is not necessarily a person, that is shorthand too. Alice is really only an address – an output of a hash function, that may or may not be associated with a specific “entity.”

Now, of course, sometimes Alice is a person. And sometimes Alice created a “token” (another metaphor) and sold it to Bob as an investment. In which case, arguably that was a securities offering and can be regulated by the SEC.

However, the SEC doesn’t stop there. The agency wants to regulate what happens to those tokens, as they interact with smart contracts too. In its November 16 “Statement on Digital Asset Securities Issuance and Trading,” the agency says:

“Any entity that provides a marketplace for bringing together buyers and sellers of securities, regardless of the applied technology, must determine whether its activities meet the definition of an exchange under the federal securities laws.”

An “entity” here refers to a legal person.

As an example, they use EtherDelta, and specifically its smart contract, saying:

“EtherDelta’s smart contract was coded to, among other things, validate order messages, confirm the terms and conditions of orders, execute paired orders, and direct the distributed ledger to be updated to reflect a trade.”

Here is where taking metaphorical thinking can easily go too far, and where the SEC is introducing vague and problematic language. EtherDelta, as an entity, provided various services (such as a webpage user interface for interacting with the smart contract). EtherDelta also developed the smart contract.

But who “provided” the smart contract? Who performed its functions? Not EtherDelta or anyone else in particular.

The SEC might regulate the EtherDelta website but to attempt to regulate the smart contract is a result of confusion.

The rabbit hole goes deeper

This confusion gets worse when the SEC talks about secondary markets for these “securities.”

Crypto assets are so new that even many experienced practitioners are confused and think that they represent a distinct property. As a result, as an industry, we have been far too willing to indulge the SEC view that since something was the product of a securities offering, it remains a security thereafter. Once we realize that there are no “tokens” and no “property,” we realize that this is a categorical error.

It becomes easy to see this error when one imagines the following scenario: Bob, having purchased the tokens from Alice sends them to a smart contract owned by nobody. He has given up claim of ownership – which would mean that no legal entity owns the “security.”

By definition, a security is an “investment contract.” A contract is “an agreement between legal persons, creating obligations that are enforceable by law.”

So for something to be a security, it must, therefore, (a) be between legal entities and (b) be enforceable by law (not math).

Tokens held by smart contracts fail both these tests. They cannot properly be described as securities. However, the SEC is suggesting something radically new: that a set of instructions which involves no agreement, no persons and is not enforced by law (but rather by math) can yet still be viewed not just as a contract but as a security. This is a radical departure from existing law.

Property laws and financial laws rely on enforcement by governments. Since there are many governments and their jurisdictions are limited, there is no truly global system of enforcement that is appropriate to the borderless world of the internet.

A huge potential benefit of crypto assets is that they overcome this problem — by not being a product of law or limited to its jurisdiction.

The SEC, for obvious reasons, would like to establish jurisdiction over crypto assets. However, this jurisdiction is only appropriate where there are legally enforceable contracts between legal entities.

For the SEC, or anyone, not to recognize this important distinction is a recipe for overreach and confusion. It has the potential to rob many of us for the benefits of a truly global, digital method of managing ownership and value.


Edan Yago

Nov 22, 2018 at 05:00 UTC

David Ogden – Http://markethive.com/david-ogden