Bitcoin (BTC) Price Weekly Forecast – Vulnerable Below $8K-$8.2K
There was a steady decline in bitcoin price below the $8,200 support against the US Dollar.
The price is currently trading below $8,000 and it remains at a risk of more losses.
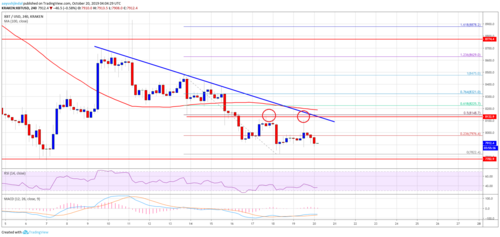
There is a major bearish trend line forming with resistance near $8,100 on the 4-hours chart of the BTC/USD pair (data feed from Kraken).
The price must climb above $8,100 and $8,200 for bullish continuation in the near term.
Bitcoin price is showing bearish signs below $8,000 against the US Dollar. BTC could extend its decline below the $7,800 support area in the near term.
Bitcoin Price Weekly Analysis (BTC)
In the past few days, BTC followed a bearish path below the $8,400 and $8,250 levels against the US Dollar. The BTC/USD pair even settled below the $8,200 support and the 100 simple moving average (4-hours). Finally, there was a break below the $8,000 support and a new monthly low was formed near $7,822. The price is currently consolidating losses and is trading below the $8,000 support.
An immediate resistance is near the $8,000 level or the 23.6% Fib retracement level of the recent decline from the $8,475 swing high to $7,822 low. On the upside, there are many hurdles near the $8,100 and $8,200 levels. Moreover, there is a major bearish trend line forming with resistance near $8,100 on the 4-hours chart of the BTC/USD pair.
Besides, the 50% Fib retracement level of the recent decline from the $8,475 swing high to $7,822 low is also near the $8,150 level. Finally, 100 simple moving average (4-hours) is positioned near the $8,200 level. Therefore, bitcoin price must surpass the $8,100 and $8,200 resistance levels to start a decent recovery. Additionally, a close above the $8,200 barrier and the 100 SMA is needed for more upsides.
On the downside, the key support is near the $7,800 level. If there is a downside break below the $7,800 support, the price could continue to decline in the near term. The next major support is near the $7,500 level, below which there is a risk of more losses towards $7,200.

Looking at the chart, bitcoin price is clearly trading in a bearish zone below the $8,000 pivot level and the $8,200 resistance. Therefore, a convincing break above $8,000 and a follow through above $8,200 is required for a strong recovery. If not, the price is likely to test the $7,500 support area.
Technical indicators
4 hours MACD – The MACD for BTC/USD is slowly moving back into the bearish zone.
4 hours RSI (Relative Strength Index) – The RSI for BTC/USD is currently recovering and it could break the 40 level.
Major Support Level – $7,800
Major Resistance Level – $8,200
Aayush Jindal
David Ogden – Http://markethive.com/david-ogden