Bitcoin Reaches Record-Low Volatility

Bitcoin Reaches Record-Low Volatility

Bitcoin Reaches Record-Low Volatility

It’s an open secret that trading in bitcoin has become more difficult in recent months than it once was. Traders rely on volatility to make their money, and with less volatility, there are fewer opportunities to trade. For long-term holders and users of bitcoin, however, it’s a very different story, and low volatility is generally seen as a sign the bitcoin market is maturing.

According to Gil Luria, research director at wealth management firm D.A. Davidson & Co., the recently stable bitcoin prices means that there is less speculation in the bitcoin economy.

“When speculators are involved, they drive unusually high volumes as well as volatility by trading the asset with high frequency. As speculator involvement is diminished, volumes go down and volatility goes down as well,” Luria told Bloomberg.

The same sentiment was also echoed by Mike McGlone, commodity strategist at Bloomberg Intelligence, explaining that bitcoin is now exhibiting signs of a “maturing market, so volatility should continue to decline.”

“When you have a new market, it will be highly volatile until it establishes itself. There are more participants, more derivatives, more ways of trading, hedging and arbitraging,” McGlone said.

Judging from the data, it appears the experts are right that both trading volume and volatility is down. Although most notably for bitcoin, the data confirms that the same is also true for many other cryptocurrencies.

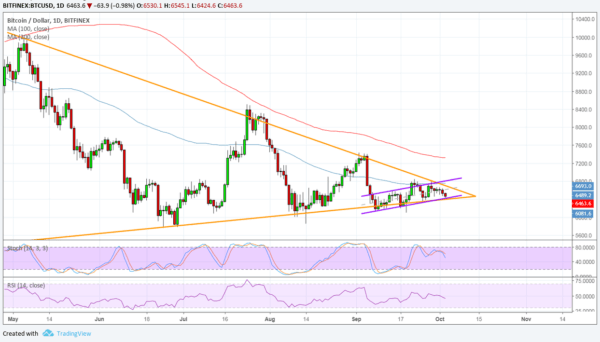
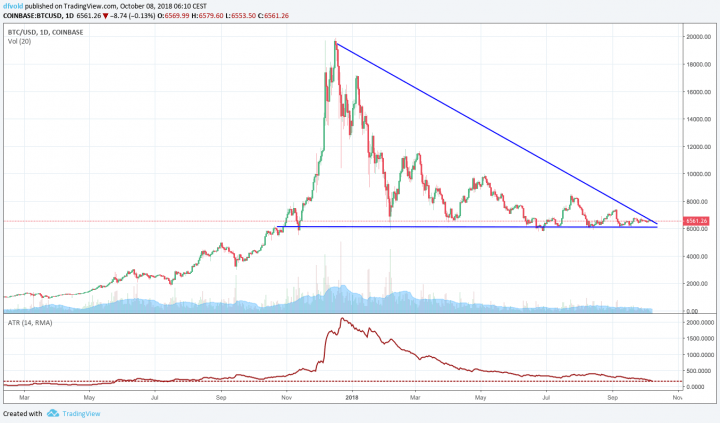
The unusually low volatility in bitcoin is confirmed by a technical indicator known as the Average True Range (ATR) indicator, as seen in the bottom of the chart below. Looking on a day-by-day basis, volatility in the bitcoin market is now down to levels not seen since July 2017, before the huge run-up in prices seen later that year.

Bitcoin’s Next Move

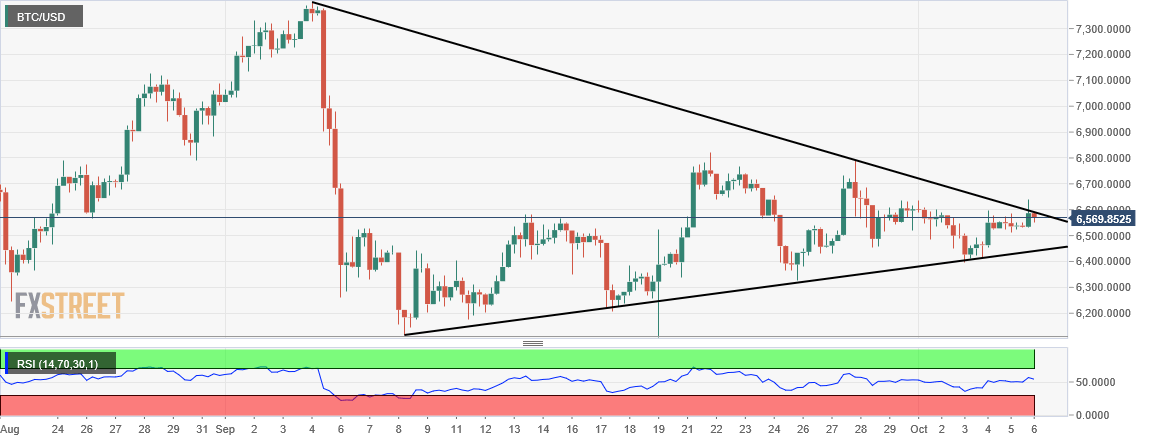
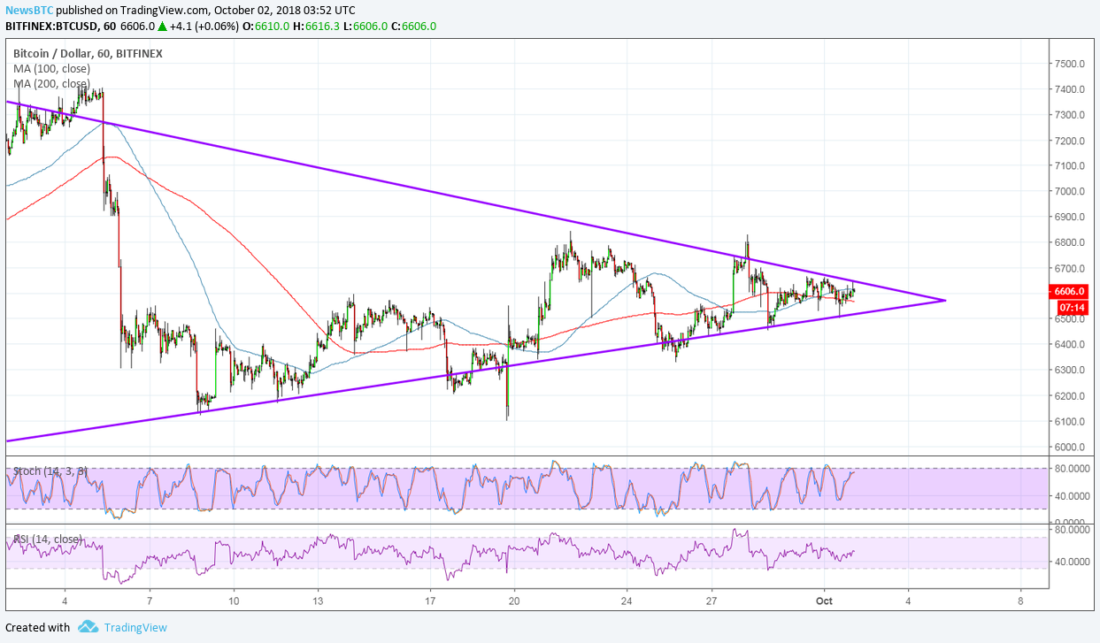
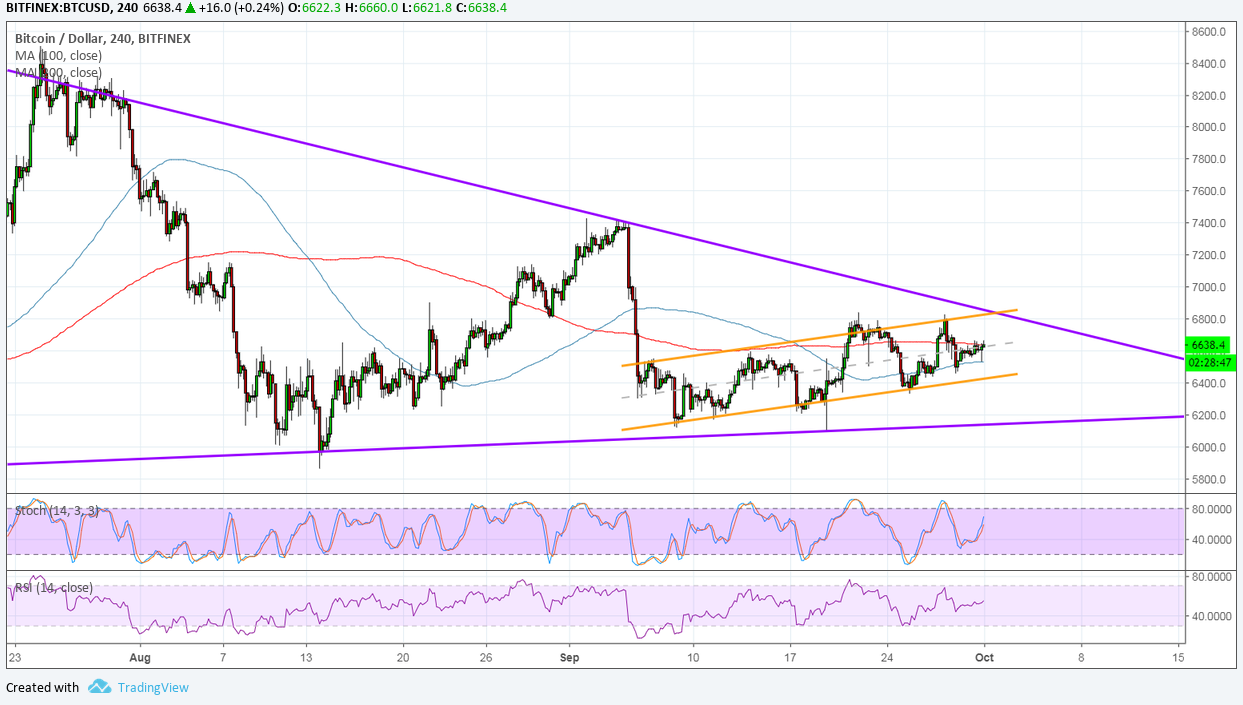
Although volatility may be low at the moment, bitcoin’s price chart looks like it is about to break-out from a massive chart pattern that has been forming since the beginning of this year.

Judging from the pattern seen above, with lower highs but a floor around the USD 6,000 mark, it appears that bitcoin is about to face another battle between bulls and bears that will determine its next move.

As we have seen throughout 2018, the selling pressure has been heavy on bitcoin, but buyers have consistently shown up at USD 6,000 to support the market. Over time, sellers have become exhausted as they have not been able to drive the price further down, and we have seen lower volatility as a result. The next few weeks may give us an indication of which side is stronger in the fourth quarter of 2018.

Meanwhile, a new informal poll indicated that the usually very cautious Wall Street investors are now overwhelmingly calling a bottom in the bitcoin market. Twitter users, however, are still skeptical, with a majority saying bitcoin still has room to fall.

In either case, the next time you read a price prediction from an expert trader, you should probably take it with a large grain of salt.


By Fredrik Vold

October 08, 2018

David Ogden – Http://markethive.com/david-ogden

New Cryptocurrency Research Shows 7 Out Of 10 American’s Feel “Uncertainty” Regarding Bitcoin

New Cryptocurrency Research Shows 7 Out Of 10 American's Feel “Uncertainty” Regarding Bitcoin

New Cryptocurrency Research Shows 7 Out Of 10 American’s Feel “Uncertainty” Regarding Bitcoin

Clovr recently decided to hold a research study, resulting in a publication called “How Do American’s Feel About Cryptocurrency?” In this research, which involved 1,000 Americans, the group aimed to “to understand their feelings about cryptocurrencies and to break down whether excitement (or fear) is the overwhelming emotion toward virtual money.” Ultimately, about 70% of Americans agreed that they felt “uncertainty” regarding cryptocurrency.

The information gathered in this study came from respondents that were abled between 18 and 80, though the average age is 36 years old. Participants engaged in the study by using the Amazon Mechanical Turk platform, which is a data-entry opportunity for individuals to fill out surveys and perform other work that pays out for participation, starting at $0.01.

The majority of Americans, about 9 out of 10 according to the study, have some kind of knowledge about cryptocurrency. Of that 90%, about 75% of Americans “feel they know what cryptocurrency is,” and “over 20% of the remainder believes they ‘sort of’ know what’s going on.” Clovr noted, “Almost 70 percent of respondents felt ‘uncertainty’ summed up their emotions regarding cryptocurrencies.”

When surveyed about why the participant would want to get involved with cryptocurrency, the top reason seemed to be “of riding the bitcoin wave or possibly getting in on the ground floor of an alternative like Litecoin or Ripple could most certainly pay massive returns … if they take off.”

Approximately 40% agreed that they would be more likely to participate in cryptocurrency if someone they knew was involved, which is just another demonstration of the “fear of missing out” (FOMO). About a third of the Americans surveyed already are involved in the cryptocurrency space, but the details showed that men “are twice as likely as women” to be already involved in cryptocurrency.

One of the other details included in this survey had to do with the income that participants made each year, determining if there was any correlation. Over half of the investors in the cryptocurrency industry have an income of between $75,000 and $99,999 annually. However, less than half of the participants that make under $25,000 took the time to do so. Still, Millennials “were almost twice as likely as any other generation to be crypto-investors.

The study concludes by saying,
 

“Americans appear to be divided in opinion over cryptocurrency and its role moving forward. It’s also apparent that while many think they know what it is, when asked whether explaining it to others was feasible, fewer believed they could do so, indicating a superficial understanding.”


David Ogden – Http://markethive.com/david-ogden

Bitcoin price analysis – Narrowing ranges, moment of reckoning is here

Bitcoin price analysis - Narrowing ranges, moment of reckoning is here

Bitcoin price analysis – Narrowing ranges, moment of reckoning is here

  • BTC on verge of breaking out of the range.

  • Upside breakout more likely than the downside.

Bitcoin, the defacto King of cryptocurrencies, is on the verge of breaking out of its month old ranged trading which has been trapped between $6,000 on the downside and $7,000 on the upside.


BTC/USD is down 0.25 percent on day at $6,569 and is stuck in less than 1 percent range for the day – speaking enough of the shrinking volatility and low weekend volumes. On the 360-minute chart, Bitcoin has been trading in a range which has now narrowed down to the point where it can only break out or down.


Chances of BTC breaking out on the upside are higher than otherwise, given the earlier trend before it fell into this range.

BTC/USD 360-minute chart:


Manoj B Rawal

FXStreet

David Ogden – Http://markethive.com/david-ogden

Bitcoin (BTC) Price Watch – Nearby Upside Targets

Bitcoin (BTC) Price Watch - Nearby Upside Targets

Bitcoin (BTC) Price Watch – Nearby Upside Targets


Bitcoin Price Key Highlights

  • Bitcoin price continues to hover above its ascending channel support on the 4-hour time frame.

  • Price appears to be consolidating after the bounce but remains on track towards testing the next upside targets.

  • The 38.2% extension level seems to have kept some gains in check, possibly sending price back down to support once more.

Bitcoin price is finding support at the bottom of its rising channel but has hit a roadblock on the first Fib extension.
 

Technical Indicators Signals

The 100 SMA is below the longer-term 200 SMA on this time frame to signal that the path of least resistance is to the downside. In other words, the selloff is more likely to resume than to reverse. Then again, the gap between the moving averages has narrowed to indicate a possible bullish crossover and return in bullish momentum.

Stochastic is still on the move up to indicate that buyers have the upper hand, but the oscillator is approaching overbought levels to reflect exhaustion. Turning back down could mean a pickup in selling pressure and a dip back to the channel support near $6,500. RSI continues to cruise sideways to reflect consolidation but has been on the move up as well.

A continuation of the climb could take bitcoin price to the 50% extension at the mid-channel area of interest or $6,700 mark. The 78.6% extension lines up with the top of the channel and the swing high, serving as a potential take-profit level as well. Stronger bullish momentum could take bitcoin price past the channel top and onto the full extension at $6,956.30.

A handful of analysts are calling a bottom on bitcoin, likely setting the tone for a strong rebound before the end of the year. A survey by Fundstrat revealed that 54% of institutional traders are optimistic about the digital currency’s prospects, although some say that it won’t reach $9,000 by December.


SARAH JENN | OCTOBER 5, 2018 | 4:02 AM

David Ogden – Http://markethive.com/david-ogden

Bitcoin won’t Break $9000 this year says Mike Novogratz


Bitcoin won’t Break $9000 this year says Mike Novogratz

One of the most prominent Bitcoin bull, Billionaire and CEO of Galaxy Digital Firm Mike Novogratz has turned short-term bearish, suggesting that Bitcoin will not break $9000 by this year end.

Speaking at Economist’s Finance Disrupted 2018 conference in Manhattan, 3rd October Novogratz suggested that he doesn’t see much chances of Bitcoin breaking the current ‘slump’ CNBC Reports.

He said:

“I don’t think it breaks $9,000 this year”


Novogratz had told that Bitcoin had bottomed in September when it was in the range of $6300-$6400, however, he still does not see Bitcoin breaking the $10000 mark by the end of this year.

The hedge fund Titan has always been bullish on Bitcoin, even before the bull run in 2017. At the time he had predicted that Bitcoin could hit $40000 easily by the end of 2018.

He expects the FOMO rally to happen anytime after the second quarter of 2019 driven by institutional investors this time instead of retail investors. We know that products like Bakkt are going to launch this year end which will make it easier for institutions to set foot in this industry.


one Vays criticized Novogratz for creating unrealistic expectations, Vays Tweeted:

Soooo, this is interesting, I have been going against @novogratz everytime he was in the news pumping #Bitcoin but how to be contrarian now?

My Take: "He is under pressure from investors on his losing $BTCUSD / #crypto position & needs to now creat 'realistic' expectations" pic.twitter.com/oDusRDcoPd


— Tone Vays [@Bitcoin] (@ToneVays) October 3, 2018

Novogratz has been actively working on building the infrastructure in the Crypto ecosystem, Novogratz’s Galaxy Digital management partnered with Bloomberg earlier this year to create a Cryptocurrency index benchmark.


Blockmanity’s Take

Bitcoin had an insane rally back in December-January which was clearly driven by a lot of speculation and the market has undergone a correction of over 70% after that which is only natural. It is not easy for anyone to predict the exact timing of these market cycle and how exactly it will play out. One should do their own due diligence and have a basic understanding of the asset class before investing and not take any one person’s word to determine how the markets will play out.

Shrikar POSTED ON OCTOBER 4, 2018

Bitcoin won't Break $9000 this year says Mike Novogratz

David Ogden – Http://markethive.com/david-ogden

Bitcoin BTC/USD Long-Term Triangle Break Soon

Bitcoin  BTC/USD Long-Term Triangle Break Soon

Bitcoin BTC/USD Long-Term Triangle Break Soon


Bitcoin has tumbled back to the bottom of its triangle consolidation pattern visible on the daily time frame but might be due for a break soon. The price is near the peak of its triangle after all, so it would need to pick a longer-term direction from here.

The 100 SMA is below the longer-term 200 SMA on this daily time frame to hint that the path of least resistance is to the downside. In other words, a break lower is more likely to happen than an upside breakout. In that case, Bitcoin could slump by the same height as the chart pattern, which spans $5,800 to $10,000.

Stochastic is pointing down, also indicating that sellers have the upper hand. This oscillator is just making its way out of the overbought zone, which means that there’s plenty of time for bears to stay in control. RSI appears to be treading sideways, reflecting current range-bound conditions and barely offering directional clues.

Bitcoin appears to have shed its gains on reports that the only Bitcoin investment trust is deeply in the red. Shares of Grayscale Bitcoin Investment Trust (GBTC) are down roughly 80% since price peaked late last year, hardly encouraging news for new investors.

Nonetheless, analysts believe that a big rally might be in order as the Lightning Network shows more signs of growth. This allows a layer to be built on top of the blockchain in order to process smaller transactions. This also speeds up processing while maintaining network security. For many, this could aid in the mainstream adoption of Bitcoin, thereby shoring up volumes and activity in the long run.

However, investors appear to be holding out for an actual positive development to break price out of its long-term consolidation and sustain any potential gains. Many had hoped it would be the SEC decision on Bitcoin ETF applications but the regulator has simply extended the comment period so far.


SARA JENN · OCTOBER 3, 2018 · 1:30 AM

David Ogden – Http://markethive.com/david-ogden

Bitcoin (BTC) Still Stuck in Consolidation, Breakout Soon?

Bitcoin (BTC)  Still Stuck in Consolidation, Breakout Soon?

Bitcoin (BTC) Still Stuck in Consolidation, Breakout Soon?
 

Bitcoin Price Key Highlights

  • Bitcoin price is still stuck inside its triangle consolidation pattern on the 1-hour time frame.

  • Price is nearing the peak of its formation so a breakout could take place soon.

  • Technical indicators are still giving mixed signals on which direction the breakout might go.

Bitcoin price is nearing the peak of its consolidation pattern, which means that a breakout is bound to happen soon.
 

Technical Indicators Signals

The 100 SMA is above the longer-term 200 SMA for now to indicate that the path of least resistance is to the upside. In other words, support is more likely to hold than to break or an upside break might be more likely than a breakdown. In that case, bitcoin price could be looking at a rally that’s at least the same height as the chart formation, which spans $6,100 to $7,300.

Stochastic is heading higher so bitcoin price could also follow suit while buyers have the upper hand. However, the oscillator is nearing overbought levels to indicate bullish exhaustion and a possible return in selling pressure. RSI, meanwhile, is cruising sideways to reflect consolidation. The moving averages have also been consolidating to signal range-bound conditions.

Bitcoin (BTC)  Still Stuck in Consolidation, Breakout Soon?

Bitcoin price has had a slew of positive developments in the previous week to keep it supported but investors seem to be holding out for more catalysts to sustain a climb this time. Momentum has been on bitcoin’s side but it would still need a few more positive developments to draw more buyers in.

The launch of bitcoin futures on ICE could bring volumes in, but keep in mind that CME futures were being blamed for the drop in bitcoin price late last year. After all it would allow investors to take short bets on the digital asset, possibly taking it for a break below consolidation onto new lows.


SARAH JENN | OCTOBER 2, 2018 | 4:12 AM

David Ogden – Http://markethive.com/david-ogden

Bitcoin (BTC) Price Analysis – Bulls Stay In Control

Bitcoin (BTC) Price Analysis - Bulls Stay In Control

Bitcoin (BTC) Price Analysis – Bulls Stay In Control

Bitcoin is still inside its symmetrical triangle but continues to trend higher short-term.

BITCOIN PRICE ANALYSIS

Bitcoin still seems to be stuck inside its symmetrical triangle consolidation on the 4-hour chart but continues to climb inside a rising channel on the shorter-term time frames. Price is pulling back to the channel support and a bounce could take it up to the resistance.

The 100 SMA is below the longer-term 200 SMA, though, so the path of least resistance is to the downside. In other words, the selloff is more likely to resume than to reverse. Then again, the gap between the two is narrowing to signal that bearish pressure is slowing and that an upward crossover could be due.

In that case, bullish momentum could pick up and take price past the top of the channel and triangle around $6,800. Note that the triangle spans around $2,500 in height so the resulting uptrend could be of at least the same size.

Stochastic is pointing back up to indicate the return of bullish momentum without even seeing oversold conditions. RSI is treading sideways to signal consolidation but seems to be crawling slightly higher as well. If resistance holds, however, bitcoin could slump back to the triangle bottom at $6,200.


By Rachel Lee On Oct 1, 2018

David Ogden – Http://markethive.com/david-ogden