Bitcoin Price Analysis: BTC/USD Testing Double Bottom Neckline
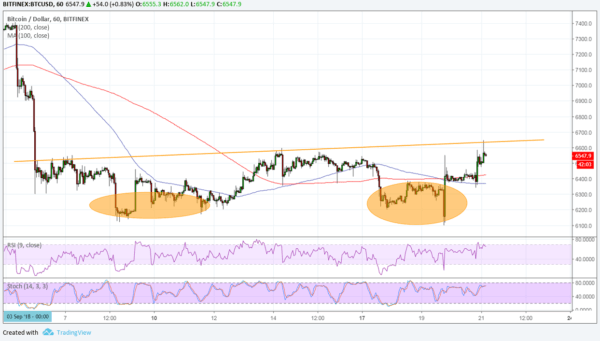
Bitcoin could be due for an uptrend anytime now as the price is already testing the neckline of its double bottom on the 1-hour chart. A break past the $6,650 area could lead to a climb that’s the same height as the chart formation, which spans $6,100 to $6,600.
However, the 100 SMA recently crossed below the longer-term 200 SMA to signal that bearish pressure is present. This could force the neckline resistance to hold and push Bitcoin back down to the bottoms again. Then again, the moving averages just seem to be oscillating to reflect consolidation conditions, so a bullish crossover might be possible again.
RSI is hovering close to the overbought zone to signal bullish exhaustion. Turning lower could confirm that sellers are taking over while buyers take a break. Stochastic has some room to climb before hitting overbought levels, though, so buyers could have a bit more energy left to push for a neckline breakout.

he SEC just issued an order to gather more input from the public to help in its ruling on the proposed rule changes to list the Bitcoin ETF from SolidX/VanEck. Recall that they already pushed the ruling deadline back on this and could still do so again, possibly not making any decision until February next year.
If so, Bitcoin bulls might still be disappointed but could continue to keep hopes up for an approval. A flat-out rejection, on the other hand, could douse any expectations that a strong rebound to the record highs could take place this year. Approval, although seemingly least likely, could usher in strong gains across the board.
The decision is due at the end of the month and analysts are already pointing to the buildup of short positions on Bitcoin, likely the cause for the sharp dip earlier this week.
SARA JENN · SEPTEMBER 21, 2018 · 1:00 AM
David Ogden – Http://markethive.com/david-ogden