Bitcoin (BTC) Price Watch – More Bears Waiting to Hop On

Bitcoin (BTC) Price Watch - More Bears Waiting to Hop On

Bitcoin (BTC) Price Watch – More Bears Waiting to Hop On


Bitcoin Price Key Highlights

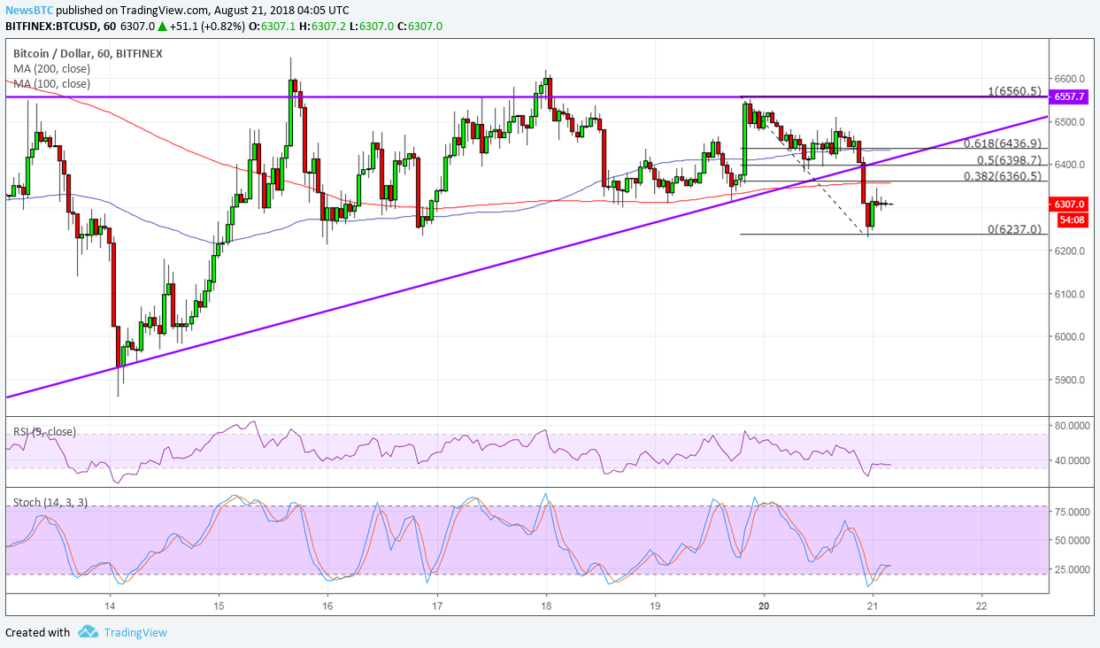
  • Bitcoin price broke below its ascending triangle consolidation to signal that more losses are in the cards.

  • Price is finding a bit of support, though, so a pullback may be taking place from here.

  • The Fibonacci retracement tool shows the next potential resistance levels, but technical indicators are signaling more gains.

Bitcoin price made a downside break from its triangle pattern and looks ready for a pullback before heading further down.


Technical Indicators Signals

The 100 SMA is above the longer-term 200 SMA to indicate that the path of least resistance is to the upside. In other words, there’s still a chance for the uptrend to resume and price to move back inside the triangle pattern.

However, the 200 SMA lines up with the 38.2% Fib at $6,360.50 to add to its strength as resistance and the 100 SMA coincides with the 61.8% Fib at $6,436.90. This is also near the broken triangle support, which might hold as resistance from here. A move past this level could lead to another test of the resistance at the swing high.

RSI already made it to oversold territory and is pulling back up to signal that buyers are returning while sellers take a break. Stochastic is also heading up to indicate a return in bullish momentum.
 

Market Factors

Bitcoin price seems to be shedding its gains due to the improvement in risk appetite in global financial markets. The economic turmoil in Turkey is taking the backseat to the upcoming trade talks between the US and China, which many traders are hoping to get positive updates from.

One thing to keep in mind, though, is these are just low-level talks and there’s a low likelihood of any decisions being made. Worsening trade tensions could even lead to a return in risk aversion and dollar weakness, which might revive demand for bitcoin. Escalating troubles in Turkey could also boost bitcoin demand as people look for an alternative store of value.


SARAH JENN | AUGUST 21, 2018 | 4:19 AM

David Ogden – Http://markethive.com/david-ogden

Bitcoin (BTC) Price Watch – Waiting for a Triangle Breakout

Bitcoin (BTC) Price Watch - Waiting for a Triangle Breakout

Bitcoin (BTC) Price Watch – Waiting for a Triangle Breakout

Bitcoin Price Key Highlights

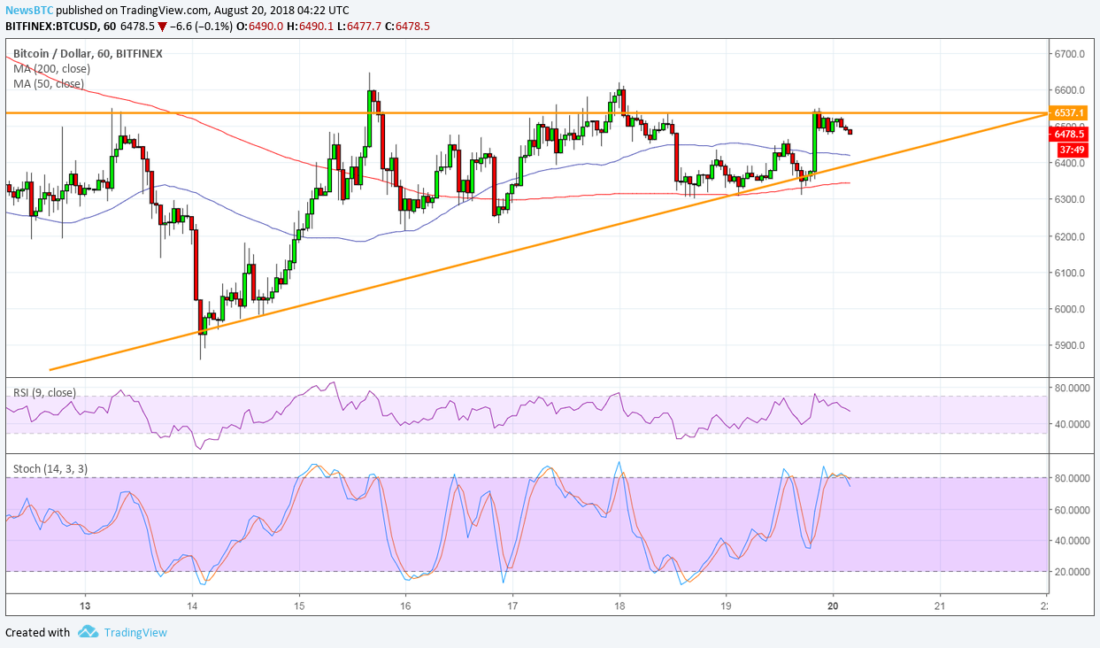
  • Bitcoin price has formed higher lows and found resistance around $6,500 to create an ascending triangle pattern on its 1-hour chart.

  • Price is currently testing the resistance and is nearing the peak of the formation, so a breakout might be due soon.

  • Technical indicators are giving mixed signals on which direction the breakout might take.

Bitcoin price is consolidating inside an ascending triangle pattern and might be due for a breakout in either direction soon.

Technical Indicators Signals

The 100 SMA is above the longer-term 200 SMA to signal that the path of least resistance is to the upside. This suggests that an upside break is more likely to occur than a break lower. Also, the moving averages are near the triangle bottom to add to its strength as a floor around $6,400.

RSI is heading lower to signal that selling pressure is in play and that resistance would likely hold for now. Stochastic is also in the overbought region and turning lower suggests a pickup in bearish momentum. The chart pattern is around $600 in height so the resulting rally or selloff after a breakout could be of the same size.


Market Factors

Bulls continue to defend long-term support levels for bitcoin, so there’s a strong chance that the floor won’t be giving way anytime soon. Buyers now have another attempt to spur a larger rebound, possibly one that could last longer on a break of nearby resistance levels.

The anticipation for the SEC decision on the bitcoin ETF applications put on hold is building up as the end of the month nears and September approaches. However, a denial could still lead to another round of losses for bitcoin and its peers while approval might see sustained gains.

Other factors pushing bitcoin around include trade-related updates and potential contagion coming from Turkey, so price could stay sensitive to headlines from here.


SARAH JENN | AUGUST 20, 2018 | 4:38 AM

David Ogden – Http://markethive.com/david-ogden
Bitcoin (BTC) Price Watch – Waiting for Reversal Confirmation

Bitcoin (BTC) Price Watch – Waiting for Reversal Confirmation

Bitcoin Price Key Highlights
 

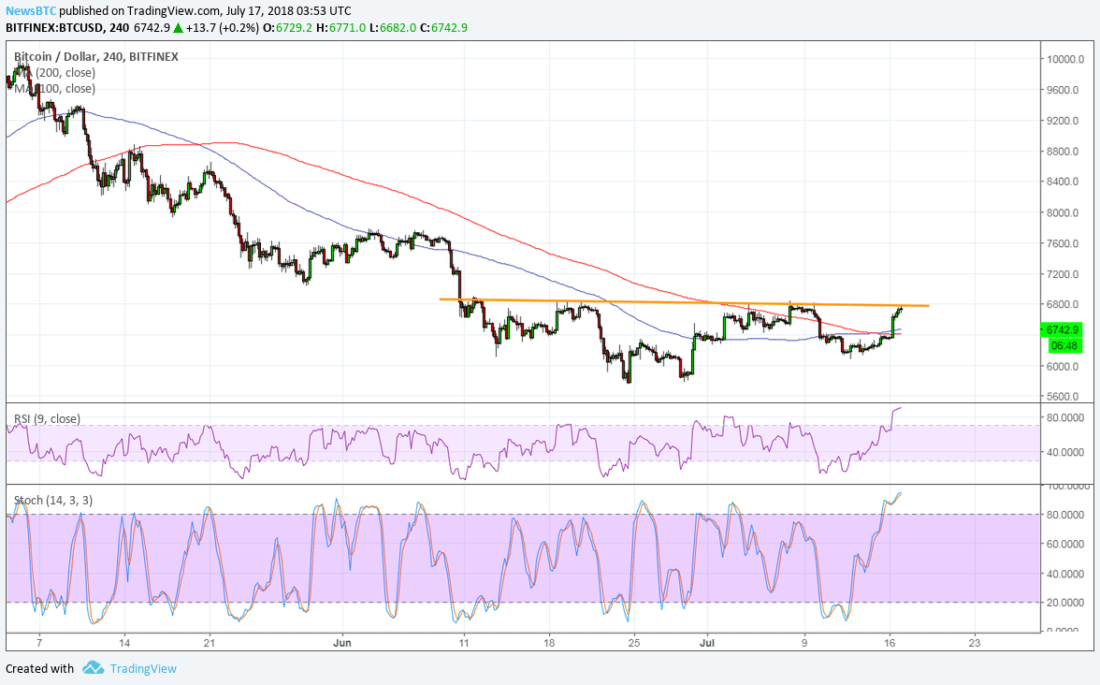
  • Bitcoin price has completed its inverse head and shoulders reversal pattern and is now awaiting confirmation.

  • Price is testing the neckline at $6,800 and an upside break could spur a $1,000 climb.

  • Technical indicators are showing mixed signals but longer-term bullish momentum could start building up.

Bitcoin price is testing the neckline of its reversal formation and confirmation could lead to a climb to $7,800 and beyond.
 

Technical Indicators Signals
 

The 100 SMA is crossing above the longer-term 200 SMA to indicate that the path of least resistance is to the upside. This means that there’s a stronger chance for the reversal to be sustained from here. Bitcoin price has also moved past the moving averages’ dynamic inflection points to signal stronger bullish momentum.


However, RSI is already indicating overbought conditions to show that buyers are feeling exhausted. Stochastic has also climbed all the way up to the overbought region to signal profit-taking and a likely dip. The moving averages could still hold as near-term support but a break below the right shoulder could signal a return in selling pressure.
 

A break past the neckline could lead to an uptrend of at least the same height as the chart formation. This spans $5,800 to $6,800 so the rally could last by at least $1,000 to take bitcoin price up to $7,800 or higher.

BTCUSD Chart from TradingView

Bitcoin price got a strong boost from confirmation that BlackRock is looking into investing in the cryptocurrency industry. CEO Larry Fink noted in an interview with Reuters that the company has formed a team to analyze the sector but clarified that they’re not seeing strong investor demand yet.
 

Still, this appears enough to revive investor optimism as institutional interest represents a lot of confidence in the industry. This comes after more conservative but well-known economists criticized cryptocurrencies for their anonymity and price volatility.


SARAH JENN | JULY 17, 2018 | 4:21 AM

David Ogden – Http://markethive.com/david-ogden
Bitcoin (BTC) Price Watch- Down But Not Out

Bitcoin (BTC) Price Watch-  Down But Not Out

Bitcoin (BTC) Price Watch- Down But Not Out!


Bitcoin Price Key Highlights
 

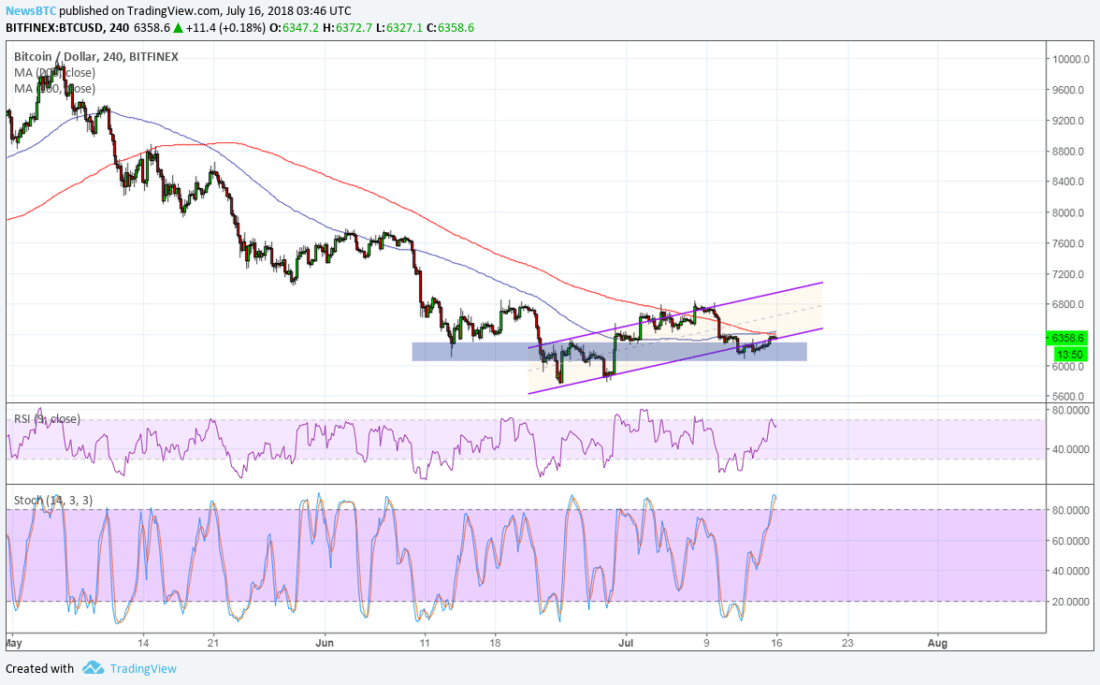
  • Bitcoin price appears to be keeping its head above the near-term area of interest at the channel support.

  • If a bounce back to the resistance happens, an inverse head and shoulders pattern could also be completed.

  • A break past the channel top could be enough to confirm that a long-term uptrend is underway.

Bitcoin price is staying above the $6,300 area of interest to signal that bulls are putting up a good fight.
 

Technical Indicators Signals


The 100 SMA is starting to cross above the longer-term 200 SMA to suggest that bearish momentum is over and that the path of least resistance is to the upside. This means that the reversal could gain more traction from here, especially once the crossover is completed.
 

In that case, support at the ascending channel could keep holding as this lines up with an area of interest or former support and resistance level. Price could find its way back to the channel top at $7,200, which would also be above the neckline of a reversal pattern.
 

Bitcoin price continues to attempt to complete the inverse head and shoulders formation on this 4-hour time frame, and this is considered a potent reversal signal. The pattern would span $5,800 to $6,800 or $1,000 in height, so the resulting uptrend could be of at least the same size.
 

However, RSI is already closing in on the overbought zone and is showing intention to head back down. This could mean that sellers are eager to push bitcoin price south again. Similarly stochastic is starting to turn upon reaching overbought territory so bitcoin could follow suit.
 

Market Factors


Bitcoin price was off to a rallying start in July but most of these gains were returned last week on negative commentary and another exchange hack. US authorities also indicted twelve Russian officials for using cryptocurrency in interfering with the 2016 elections.


This time, the focus could remain on related headlines that could determine whether the bullish run could resume or if another set of downbeat updates could force a continuation of the earlier slide


SARAH JENN | JULY 16, 2018 | 3:57 AM

David Ogden – Http://markethive.com/david-ogden
Bitcoin Price Defends $6K As Upside Potential Builds

Bitcoin Price Defends $6K As Upside Potential Builds


Bitcoin (BTC) may be up slightly at the start of Friday's session, but it remains to be seen if it can build traction above $6,000.


The world's largest cryptocurrency by market capitalization is now down 37 percent from its May 5th high at $9,996 according to CoinDesk's Bitcoin Price Index, though it's rebounded to a crucial support zone at $6,235, according to Bitfinex data.


The figure is notable, as it could be argued bitcoin needs a daily close above the previous low at $6,070 to abort bearish outlook for the coming week. This would provide greater confidence to the market as a whole, and could possibly spark another minor bullish revival seen over the last eight days.


And so far in today's session, it appears a bullish reversal pattern might be playing out.
 

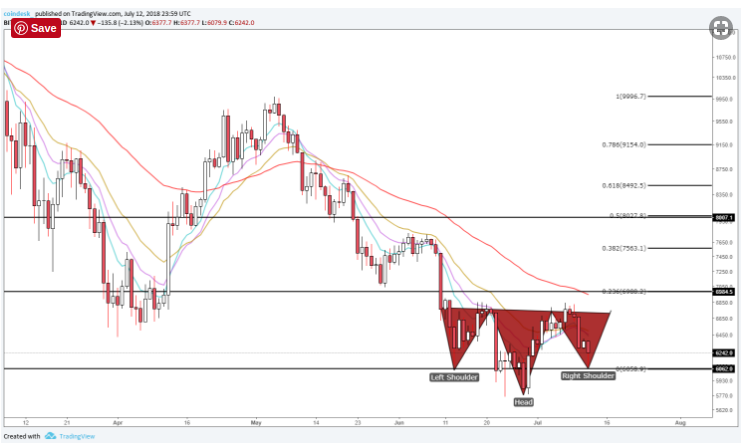
The inverse head and shoulders pattern as reported by CoinDesk yesterday continues to remain in play as the bears were unable to push the right shoulder below the neckline located at $6,064, adding to the strong possibility of a head-and-shoulders reversal.
 

Daily chart

Provided the H&S pattern stands, the Fibonacci Retracement tool (taken from previous high on May 5 to July 12 bottom of the current bullish reversal candle) shows significant resistance awaits at $6,400, $6900, $7,021 and $8,046.
 

The 55 exponential moving average (red line) also remains well above the current price, which suggests the troubled crypto remains bearish in the long term until prices start to crash through the crucial $7,000 resistance zone.
 

Further, the channel between $6,070 and $7,012 remains an incredible uphill battle for the world's most infamous digital cryptocurrency.
 

Relative Strength Index (RSI)

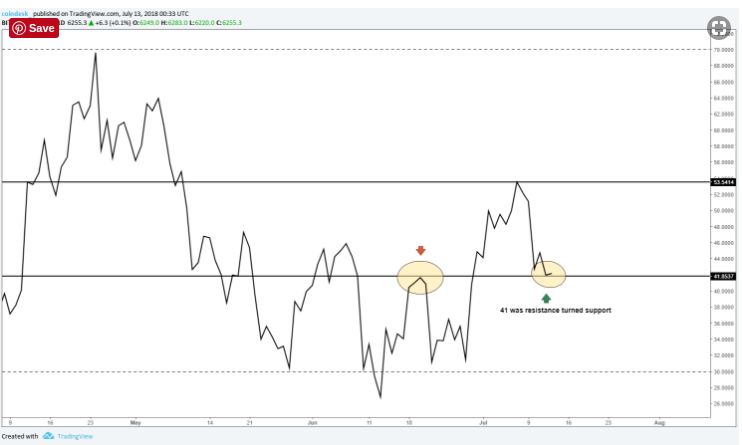
The Relative Strength Index (RSI) on the daily so far offers some solace to back the current H&S reversal which is currently bouncing from the 41.8 point line, previously seen as resistance.


If it holds above and remains within the channel (between 41 and 53) another attempt to push toward previous resistances at $6,472 could be possible.
 

View
 

  • Bitcoin risked falling below the current inverse H&S neckline around $6,073 but has since recovered slightly to keep the pattern in play.

  • RSI has yet to dip significantly – adding room for further upward momentum

  • Acceptance below $6,000 would invalidate bullish technical setup.

  • Bulls would like acceptance above $6,400 to abort short-term bearish perspective.


Author Sebastian Sinclair Jul 13, 2018 at 03:00 UTC

David Ogden – Http://markethive.com/david-ogden

Analyst Predicts Bitcoin Price Rebound Above $10,000 by 2019

Analyst Predicts Bitcoin Price Rebound Above $10,000 by 2019

Analyst Predicts Bitcoin Price Rebound Above $10,000 by 2019

Todd Gordon, founder of TradingAnalysis.com predicted Bitcoin (BTC) to drop to $4,000 prior to a rebound above $10,000 by 2019 on CNBC’s Stock Draft June 22.


Gordon suggested that BTC will drop below $5,000, subsequently hitting $10,000 by the end of the year, citing significant market volatility to be the main reason. When asked to explain his estimates, Gordon cited a “beautiful uptrend,” and called the recent correction down from $19,000 “inconsequential” given the gains in BTC price since 2015.


The analyst said that the current high to low range is 17 percent on average, which is one of the lowest BTC has ever seen. “There were times when it was 20, 30, 40 percent [per] week so, if I’m down 30 percent right now in Bitcoin, that’s nothing, I can make that up in two weeks,” he continued.


Gorgon argued that the cryptocurrency market is “very technically driven,” so reckoning on the technicals and market sentiment, it’s possible to recover certain losses in the near future.


Gordon’s site, TradingAnalysis.com, provides market analysis and trading strategies. Gordon has also made predictions about other markets, including commodities like crude oil. In November 2015, when crude was trading at $41, he predicted a decline of nearly 50 percent down to $26. In February of the following year, crude was trading at $26.05.


Earlier in June, stock analytics firm Trefis estimated a BTC year-end price of $12,500, which is $2,500 lower than their initial forecast. Trefis’ BTC forecast analytics is based on fundamentals of supply and demand, where demand is the number of users and the amount of transactions, and supply is the number of available BTC.


Last month, Wall Street analyst Spencer Bogart said that the major cryptocurrency will trade “at least” above $10,000 by the year’s end. He suggested that the reality of a deeper institutionalization of the crypto space is securing the long term “story,” and is “overall positive” for Bitcoin’s future.


Author Ana Alexandre

David Ogden – Http://markethive.com/david-ogden
Bitcoin (BTC) Price Watch – Make or Break at Channel Resistance

Bitcoin (BTC) Price Watch -  Make or Break at Channel Resistance

Bitcoin (BTC) Price Watch – Make or Break at Channel Resistance

Bitcoin Price Key Highlights


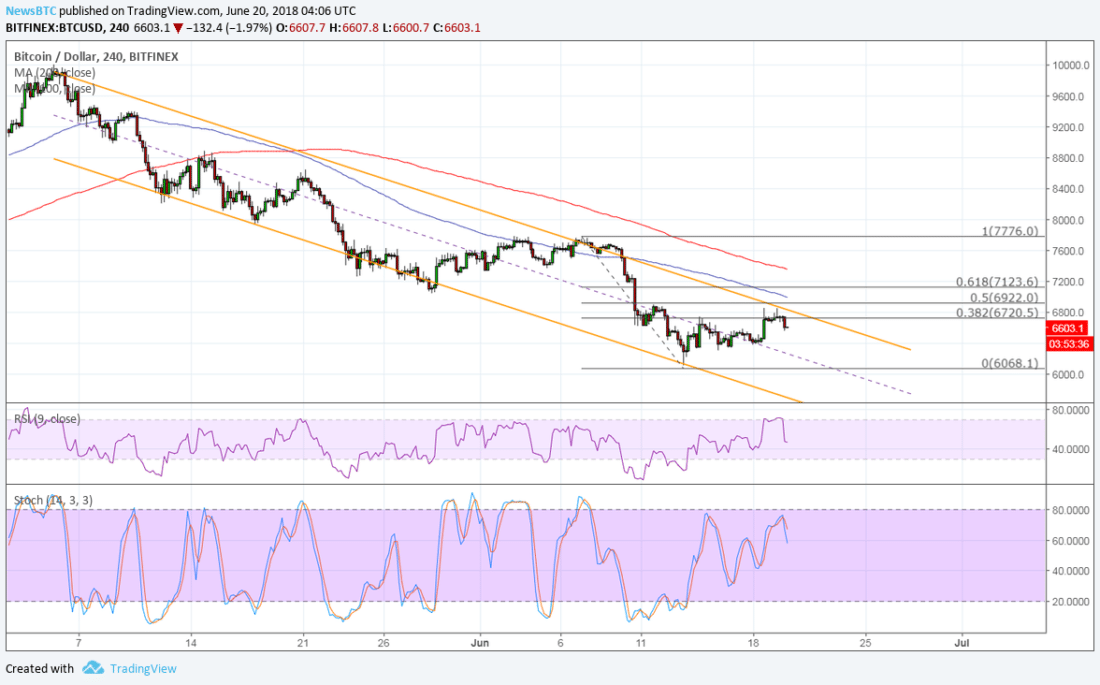
  • Bitcoin price looks ready to resume the slide after hitting the resistance at the descending channel.

  • This lines up with the Fib retracement levels, adding strength to the ceiling.

  • Technical indicators also support a continuation of the downtrend.

Bitcoin price climbed to the top of its descending channel where sellers were waiting to push it back down.
 

Technical Indicators Signals
 

The 100 SMA is still below the longer-term 200 SMA to confirm that the path of least resistance is to the downside. This suggests that the selloff is more likely to resume than to reverse.


The shorter-term moving average is also close to the 50% Fibonacci retracement level to signal that selling pressure is returning. This might be enough to push bitcoin price back to the channel support around $6,000 or lower.


RSI is also turning lower from the overbought zone to signal a return bearish momentum. Similarly stochastic is turning lower without even hitting overbought levels, indicating that bears are eager to return.


If bulls keep charging, there are still a couple of upside roadblocks to contend with. This is the 200 SMA dynamic inflection point at $7,600 and the swing high around $7,800. From there, a move past the $8,000 handle could signal that the uptrend is gaining traction.

Bitcoin price got another blow from remarks by Goldman Sachs CEO Lloyd Blankfein who said that this cryptocurrency is not for him. However, there is still some degree of positive sentiment coming from the New York FSA’s approval of Square’s Cash mobile app license and remarks from a senior SEC official last week citing that bitcoin shouldn’t be treated as a security.


However, dollar strength is proving tough to oppose as risk aversion on a fresh round of tariffs threats is keeping the safe-haven currency supported even against bitcoin.
 

SARAH JENN | JUNE 20, 2018 | 4:38 AM

David Ogden – Http://markethive.com/david-ogden

Bitcoin (BTC) Price Watch – Can It Finally Bounce?

Bitcoin (BTC) Price Watch - Can It Finally Bounce

Bitcoin (BTC) Price Watch – Can It Finally Bounce?


Bitcoin Price Key Highlights


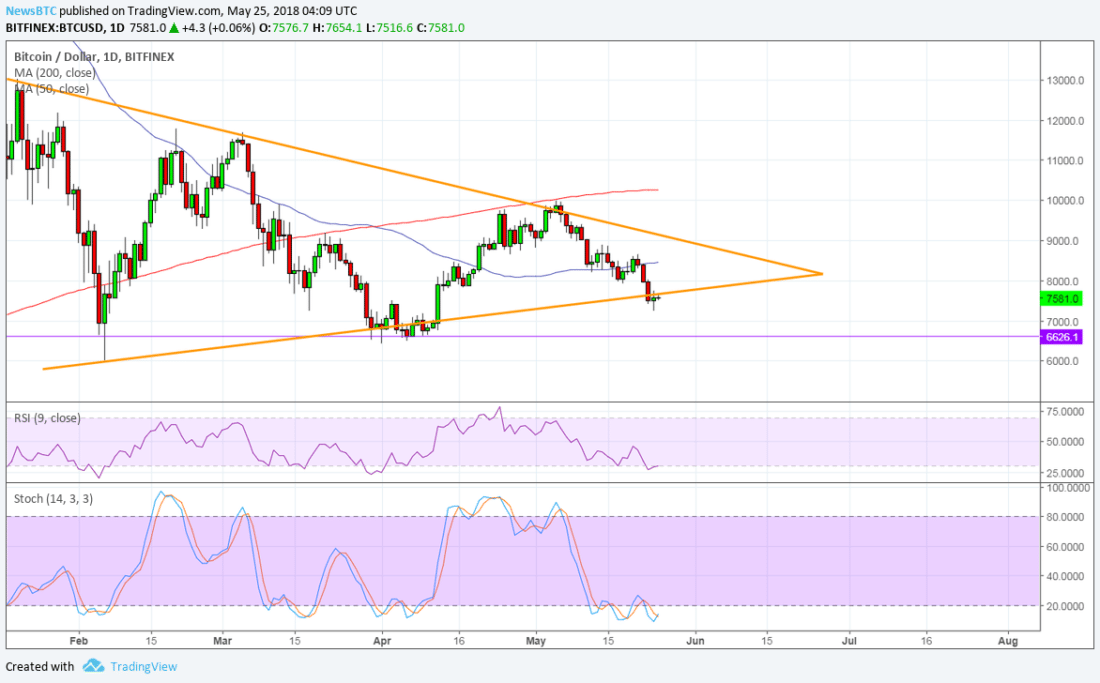
  • Bitcoin price is still inside its symmetrical triangle formation and is currently testing support.
  • A bounce could take it back up to the resistance around $9,000 while a break lower could lead to a test of the next support at $6,500.
  • Technical indicators are showing mixed signals, so the move could mostly depend on market catalysts.

Bitcoin price has sold off to the very bottom of its symmetrical triangle formation, still pending a bounce or a break.

Technical Indicators Signals


The 100 SMA is below the longer-term 200 SMA so the path of least resistance is still to the downside. This suggests that a breakdown is more likely to happen than a bounce.

The gap between the moving averages is also widening to show accelerating bearish momentum. Also, price is below the 100 SMA dynamic inflection point to reflect continued selling pressure.

RSI is heading south to show that sellers have the upper hand, but the oscillator is already dipping into oversold territory to signal exhaustion. Turning higher could draw buyers back in and lead to a bounce back to the resistance. Similarly, stochastic is indicating oversold conditions but has yet to turn higher to signal a return in bullish pressure.


Market Factors

Regulatory fears are being blamed for the recent leg lower in bitcoin price, although this could prove positive for the industry in the longer run. The US Department of Justice is reportedly conducting a criminal probe into price manipulation practices involving cryptocurrencies.

It’s worth noting that the dollar has been on weaker footing following the FOMC minutes release and the recent announcements related to North Korea. Trump has cancelled his meeting with Kim Jong-Un for next month, reviving geopolitical tensions but weighing on the US currency. However, bitcoin price has been unable to take advantage of this as it also seems to have been dragged lower by risk sentiment.


Author SARAH JENN | MAY 25, 2018 | 4:28 AM


Posted by David Ogden Entrepreneur

David Ogden – Http://markethive.com/david-ogden
Bitcoin Price Watch – How Low Can BTC Go?

Bitcoin Price Watch -  How Low Can BTC Go

Bitcoin Price Watch – How Low Can BTC Go?

Bitcoin Price Key Highlights
 

  • Bitcoin price has bounced off the area of interest previously highlighted to signal that the selloff would resume.

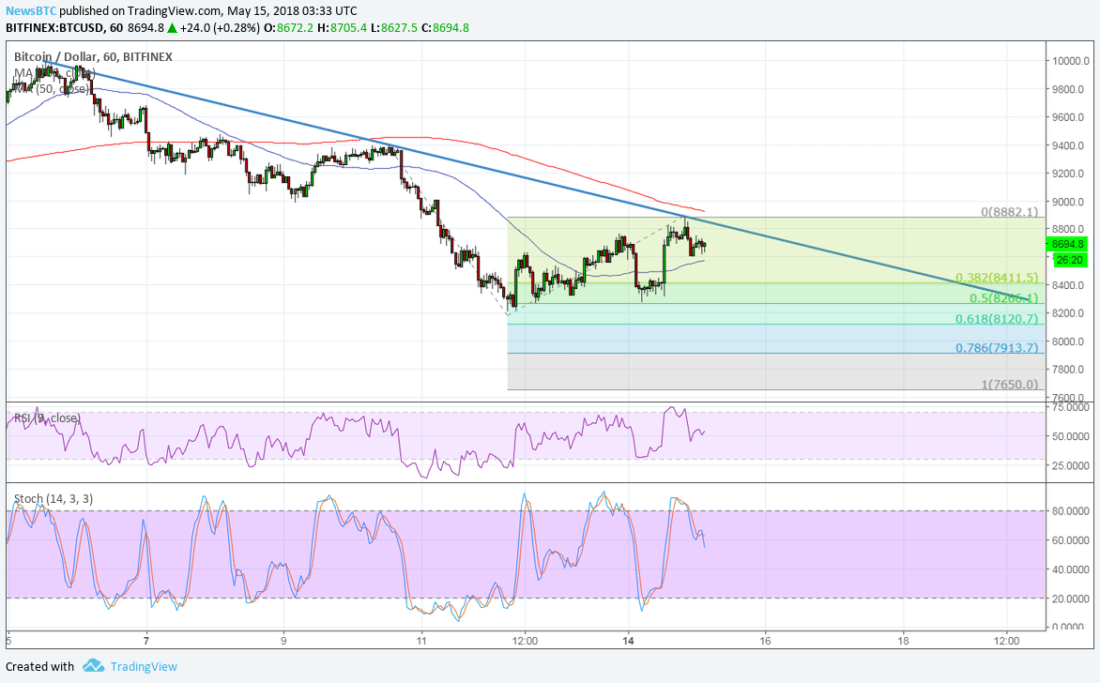
  • Applying the Fibonacci extension tool shows how low bitcoin could go from here.

  • Technical indicators are showing mixed signals, with the oscillators reflecting more bearish pressure.

  • Bitcoin price is bouncing off the downtrend line and looks ready to resume the drop to new lows.

Technical Indicators Signals

The 100 SMA is below the longer-term 200 SMA to confirm that the path of least resistance is to the downside or that the selloff is more likely to continue than to reverse. The 200 SMA also lines up with the downtrend line to add to its strength as a ceiling.

However, the gap between the moving averages is narrowing to signal a potential upward crossover or return in bullish momentum. The 100 SMA might also be able to hold as dynamic support. If so, a move past the trend line, swing high and $9000 mark could confirm that an uptrend is taking place.

RSI is turning lower to show that sellers have the upper hand. Stochastic has also made its way out of the overbought zone and is heading south, so bitcoin price might follow suit. The 38.2% extension is at the $8400 area and the 50% level is close to the swing low. Stronger selling momentum could take bitcoin price to the 78.6% extension at $7913 or the full extension at $7650.

BTC/USD 1-hour Chart from TradingView
 

Market Factors

Bitcoin price seems to be off to another shaky start for the week as another failed attempt at breaking past $9,000 has drawn more selling pressure and spooked some bulls. However, positive updates in the industry are still popping up and could ultimately allow the climb to resume.

At the moment, what’s keeping investors on edge is the possibility that Mt. Gox will short another set of bitcoin to pay off its creditors. An estimated 8,000 coins are still up for selling, so this could have a huge weight on price.


Source: https://www.newsbtc.com/2018/05/15/bitcoin-price-watch-low-can-btc-go/
 

Posted by Daving Ogden Entrepreneur

David Ogden – Http://markethive.com/david-ogden
Bitcoin price analysis -BTC/USD gets badly beaten, poking at $9,000 – Gary Cohn believes in crypto, but not in Bitcoin

Bitcoin price analysis -BTC/USD gets badly beaten, poking at $9,000 – Gary Cohn believes in crypto, but not in Bitcoin


  • BTC/USD broke below local support levels with no obvious triggers.

  • former president of Goldman Sachs Gary Cohn supports the idea of global cryptocurrency.


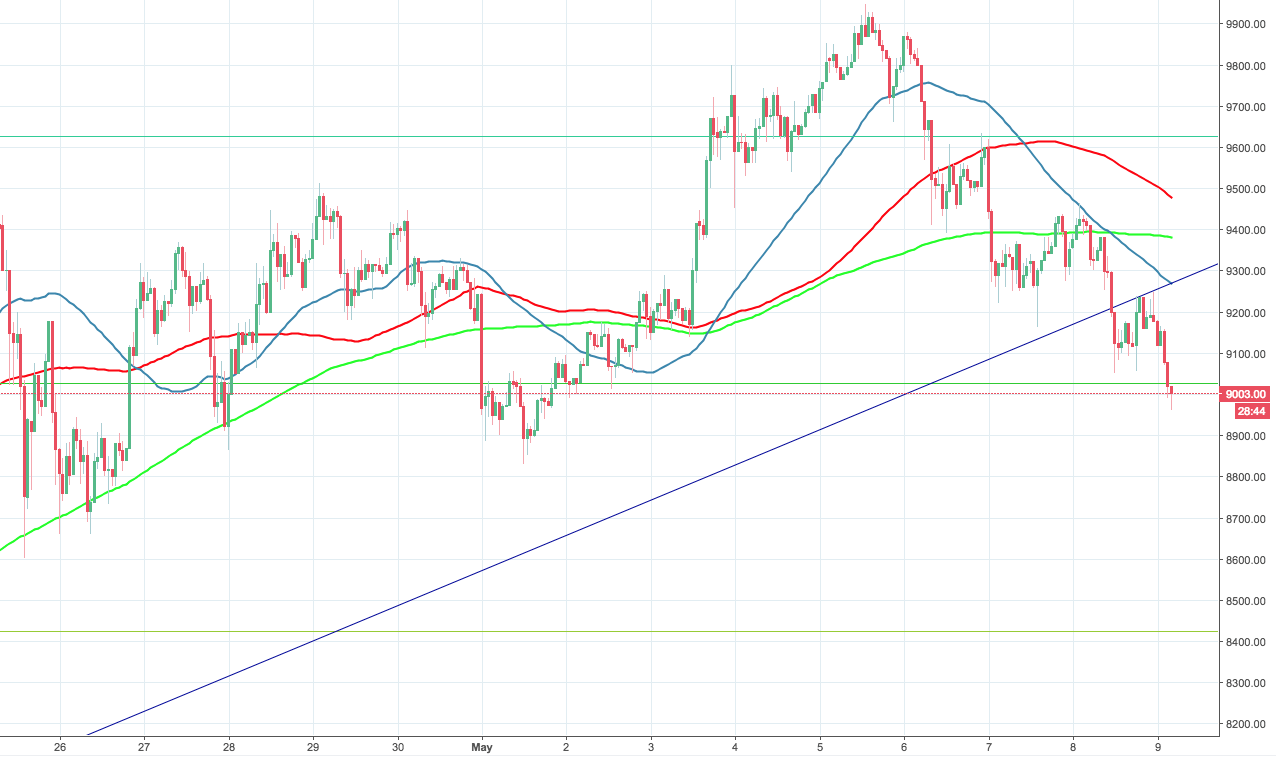
Bitcoin lost over 8% in just three days, crashing from $10,000 to below $9,000. BTC/USD is trading at $9,017, after a short dip to $8,960. The coin is 3% lower than 24 hours before. BTC has moved into a dangerous support zone as a sustainable movement below $9,000 threshold will trigger selling orders and push the coin deeper into the bearish territory. The downside may be partially explained by US Dollar growth on international markets.


Meanwhile, former president of Goldman Sachs Gary Cohn said that the world will have a cryptocurrency after all, but it won't be Bitcoin. He believes that we will end up with something easier and more user-friendly.


"I'm not a big believer in bitcoin. I am a believer in blockchain technology," Cohn explained in the interview with CNBC. "I do think we will have a global cryptocurrency at some point where the world understands it and it's not based on mining costs or cost of electricity or things like that," he added.


Bitcoin technical picture


The hourly chart shows that BTC/USD is trading below both 200 and 50-SMAs that are located at $9,276 and $9,383 respectively. They are likely to limit the upside on approach to $9,400. Once it is broken, the upside may be extended towards $9,584 (100-SMA). On the downside the vital support comes at $9,000. This psychological level coincides with 50% Fibo retracement of the downside movement from $1,1567 to $6,483. Once it is broken, $8,700 will come into focus.


BTC/USD, the hourly chart


Author Tanya Abrosimova

Posted by David Ogden entrepreneur


David Ogden – Http://markethive.com/david-ogden