Bitcoin price analysis – Bullish divergence in play above $6,300; BTC/USD jumps 2% on the day
-
Bitcoin price welcomes the bullish trend, clears the resistance at $6,300 and targets $6,400 in the near-term.
-
BTC/USD Must find support above the 61.8% Fib level above $6,300, although other support levels will come in handy if a reversal occurs.
-
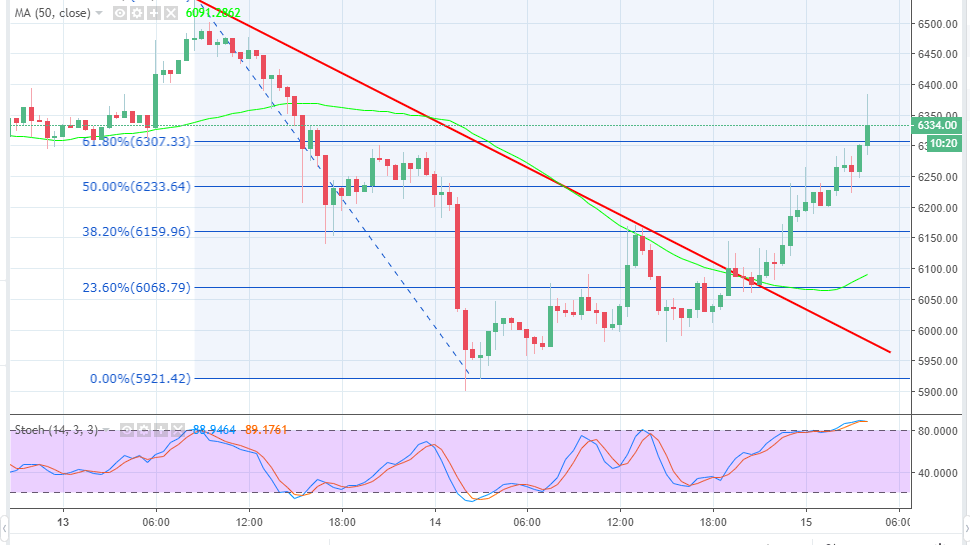
Bitcoin price appears to have curved another trajectory path and this time the rendezvous point is $6,400 in the short-term. The largest crypto by market capitalization dipped below $6,000 yesterday adding sorrow to an already gloomy market. The trading on Wednesday 15 Asian hours is strongly bullish as the chart shows a clear divergence with support at $6,000.
The stochastic is showing higher highs as it advances into to overbought region, which means that buying power is rising again. In fact, Bitcoin has broken the trendline resistance at the 23.6% Fib retracement level at $6,069.35. This has triggered a break above the resistance at $6,200 as well as that at $6,300.
Bitcoin is currently trading above the 61.8% Fib retracement level with the last swing high of $6,545.86 and a swing low of $5,921.42 at $6,307.21.The trend is strongly bullish at the time of press, besides the next resistance target is at $6,400 while the buyers are psychologically eyeing $6,500.
On the flip side, a support must be formed above the 61.8% Fib level and preferably at $6,330. This will give the buyers time to regroup and gather the strength to attack $6,400 and test $6,500 in the medium-term. Other support areas include $,6,300 and $6,250 respectively.
BTC/USD 15-minutes chart

John Isige
FXStreet

David Ogden – Http://markethive.com/david-ogden