Bitcoin (BTC) Price Watch- Sellers Picking Up Steam!
-
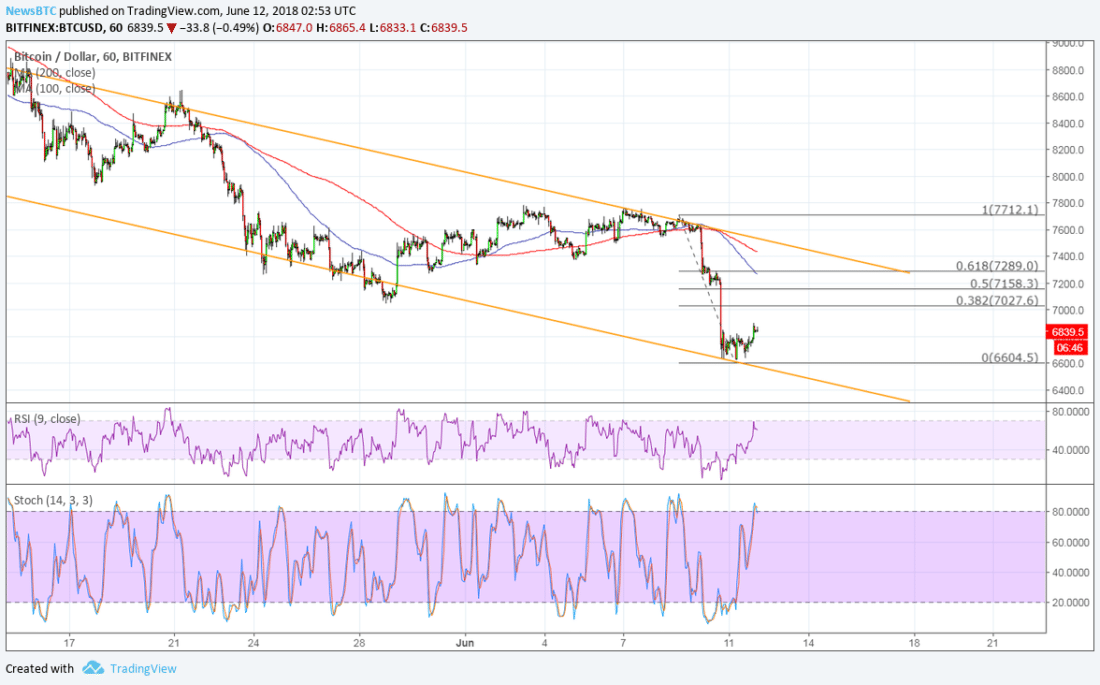
Bitcoin price has formed lower highs and lower lows to trade inside a descending channel on its 1-hour chart.
-
Price is testing support and a bounce could take it back up to the resistance or the Fibonacci retracement levels.
-
Technical indicators are suggesting that the downtrend is likely to resume.
Bitcoin price could be due for a pullback on its downtrend as it bounces off the bottom of its descending channel.
Technical Indicators Signals
The 100 SMA is below the longer-term 200 SMA to indicate that the path of least resistance is to the downside. In other words, the selloff is more likely to resume than to reverse. The gap between the moving averages is also widening to reflect strengthening bearish pressure.
In addition, the 100 SMA lines up with the 61.8% Fibonacci retracement level at $7,289 to add to its strength as a ceiling. The 50% level is closer to the former swing low around $7,200 so this might also keep gains in check.
RSI is still heading up so bitcoin price might follow suit. However, this oscillator is already nearing overbought territory to show that buyers are getting tired and may let sellers take over. In that case, another dip back to the swing low at $6,600 or the channel bottom closer to $6,400 may take place.
Stochastic is already indicating overbought conditions to suggest a return in selling pressure. If sellers are eager to hop in, the correction could be shallow and price might still be able to break below support to start a steeper drop.

Bitcoin price is still under pressure from news of the hack on a small South Korean exchange as this still spooked several investors to liquidating more positions. Security issues in the industry haven’t been completely addressed after all and there are still jitters over the ongoing investigation into price manipulation.
Author SARAH JENN | JUNE 12, 2018 | 4:55 AM
David Ogden – Http://markethive.com/david-ogden