Bitcoin (BTC) Price Analysis – Wedge Resistance Holding, Support Next?
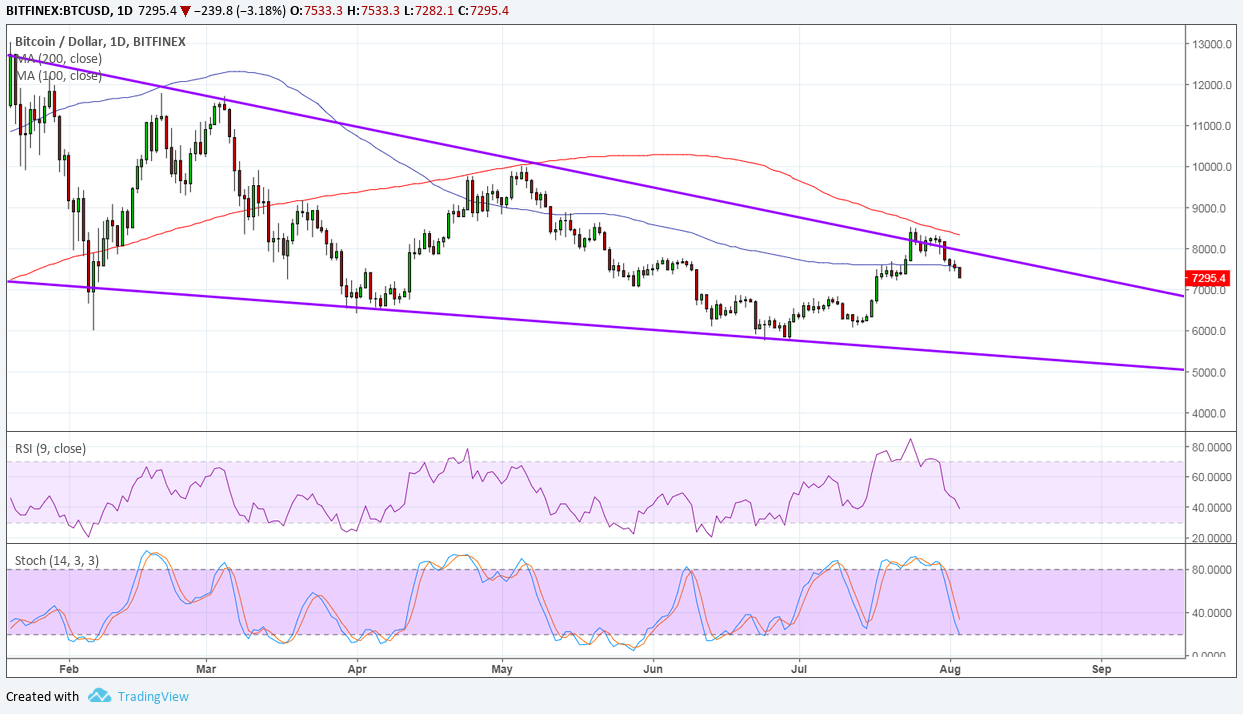
Bitcoin appears to be blocked at the top of its daily falling wedge formation.
Bitcoin has formed lower highs and lower lows to create a falling wedge pattern on its daily chart. Price is hitting a roadblock at resistance and might be due to test support once more.
The 100 SMA is still below the longer-term 200 SMA to indicate that the path of least resistance is to the downside. This means that the selloff is more likely to resume than to reverse. Price also came close to testing the 200 SMA dynamic resistance and is tumbling below the 100 SMA dynamic inflection point.
RSI is also heading south so bitcoin might follow suit while sellers remain in control. Stochastic is also heading lower to indicate the presence of selling pressure. Both oscillators have a bit more room to slide but are nearing oversold levels to signal potential exhaustion among sellers and a possible return in bullish pressure later on.
At the same time, the gap between the moving averages is starting to narrow to reflect slower bearish momentum. An upward crossover could bring buyers in and spark an upside break from the wedge resistance. This chart pattern spans $6,000 to around $12,000 so the resulting uptrend could be of the same height.

Bitcoin has had a rough ride in the past few days since it was bogged down by the HitBTC outage and negative remarks from Krugman. South Korea’s plans to tax cryptocurrency exchanges also weighed on prices. Still, some say that this also marks a much-needed pullback from consecutive weekly gains.
Institutional interest remains strong but probably not enough to make it to the headlines these days. Having the spotlight turn back to these kinds of updates could bring more gains for bitcoin and its fellow cryptocurrencies as funds from institutions could bring more liquidity and stronger volumes, likely drawing retail traders to reopen long positions.
By Rachel Lee On Aug 3, 2018
David Ogden – Http://markethive.com/david-ogden