Bitcoin (BTC) Price Watch – Make or Break at Channel Resistance
Bitcoin Price Key Highlights
-
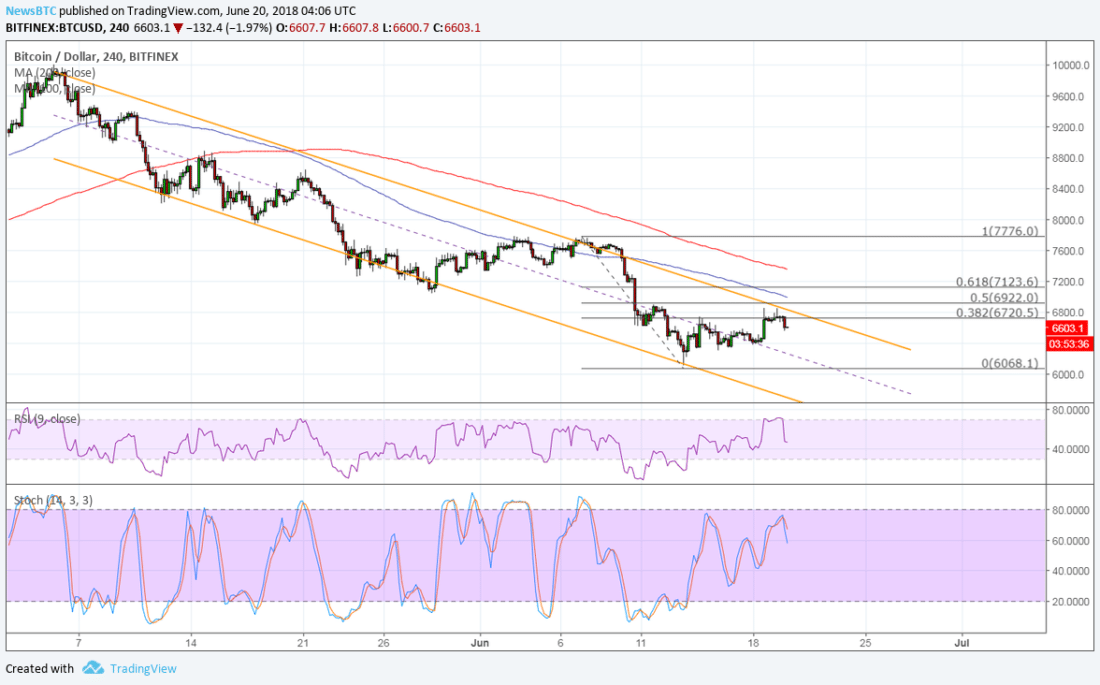
Bitcoin price looks ready to resume the slide after hitting the resistance at the descending channel.
-
This lines up with the Fib retracement levels, adding strength to the ceiling.
-
Technical indicators also support a continuation of the downtrend.
Bitcoin price climbed to the top of its descending channel where sellers were waiting to push it back down.
Technical Indicators Signals
The 100 SMA is still below the longer-term 200 SMA to confirm that the path of least resistance is to the downside. This suggests that the selloff is more likely to resume than to reverse.
The shorter-term moving average is also close to the 50% Fibonacci retracement level to signal that selling pressure is returning. This might be enough to push bitcoin price back to the channel support around $6,000 or lower.
RSI is also turning lower from the overbought zone to signal a return bearish momentum. Similarly stochastic is turning lower without even hitting overbought levels, indicating that bears are eager to return.
If bulls keep charging, there are still a couple of upside roadblocks to contend with. This is the 200 SMA dynamic inflection point at $7,600 and the swing high around $7,800. From there, a move past the $8,000 handle could signal that the uptrend is gaining traction.

Bitcoin price got another blow from remarks by Goldman Sachs CEO Lloyd Blankfein who said that this cryptocurrency is not for him. However, there is still some degree of positive sentiment coming from the New York FSA’s approval of Square’s Cash mobile app license and remarks from a senior SEC official last week citing that bitcoin shouldn’t be treated as a security.
However, dollar strength is proving tough to oppose as risk aversion on a fresh round of tariffs threats is keeping the safe-haven currency supported even against bitcoin.
SARAH JENN | JUNE 20, 2018 | 4:38 AM
David Ogden – Http://markethive.com/david-ogden