Did you want to buy Bitcoin at $3k last year, what about now?

Did you want to buy Bitcoin at $3k last year, what about now?

Did you want to buy Bitcoin at $3k last year, what about now?

BTCUSD trading at around $17,000, what is the first question you would have asked yourself? Why didn’t I buy at $3,000 just 4 months earlier in August?

A week later as the markets reached there now historical high of over $20,000. Some of those questions would have in many cases hinted at frustration, disappointment and even anger in missing out on what many called “ a once in a generation” opportunity.

Those who did enjoy the notion of triumph, and were beneficiaries of the price rise would have had even greater hopes for future peaks. $50,000, $75,000 and even $100,000 to 1 Bitcoin in the coming year (2018) were forecasted. So now with the market on the edges of $3000 once again. What questions are being asked now? Or better yet what answers are we getting to the questions asked a year ago.

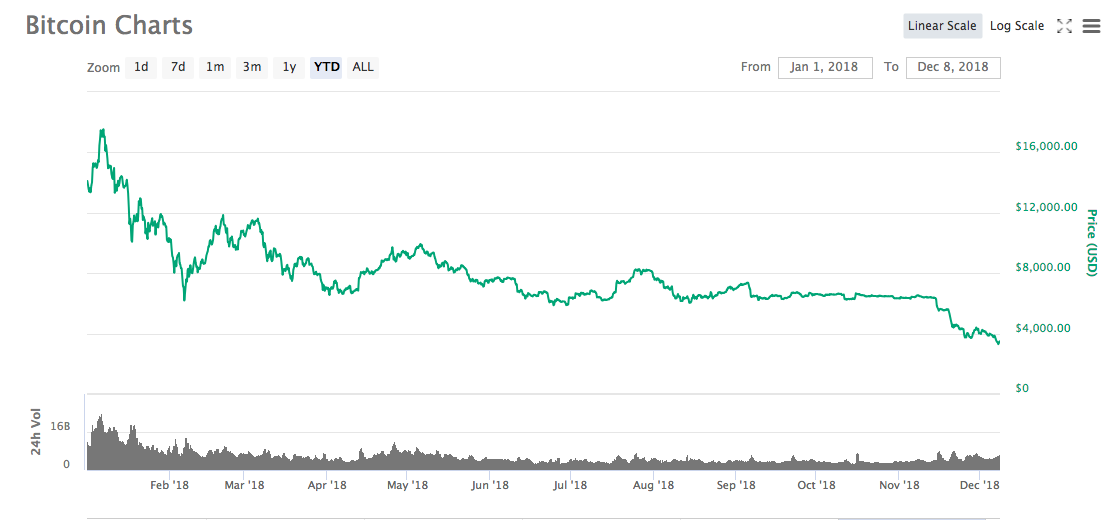
The questions the markets are asking now is where are those who thought they missed out on the opportunity? BTCUSD, and crypto coins in general has been the big bear market story of 2018, many speculators saw the initial rise of crypto’s as the dawn of a new age in finance and civilization, where no one establishment dicated the rules. Many may still believe this to be the case, however after falling $14,000 in value YTD even the biggest optimists are having there views tested. Have traders been scared off? Stopped out of positions, or eagerly awaiting the turnaround of turnarounds before running out of margin?

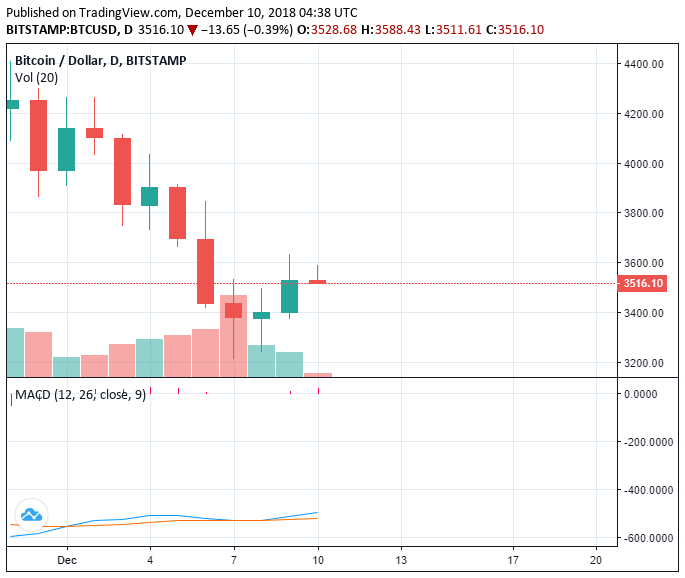
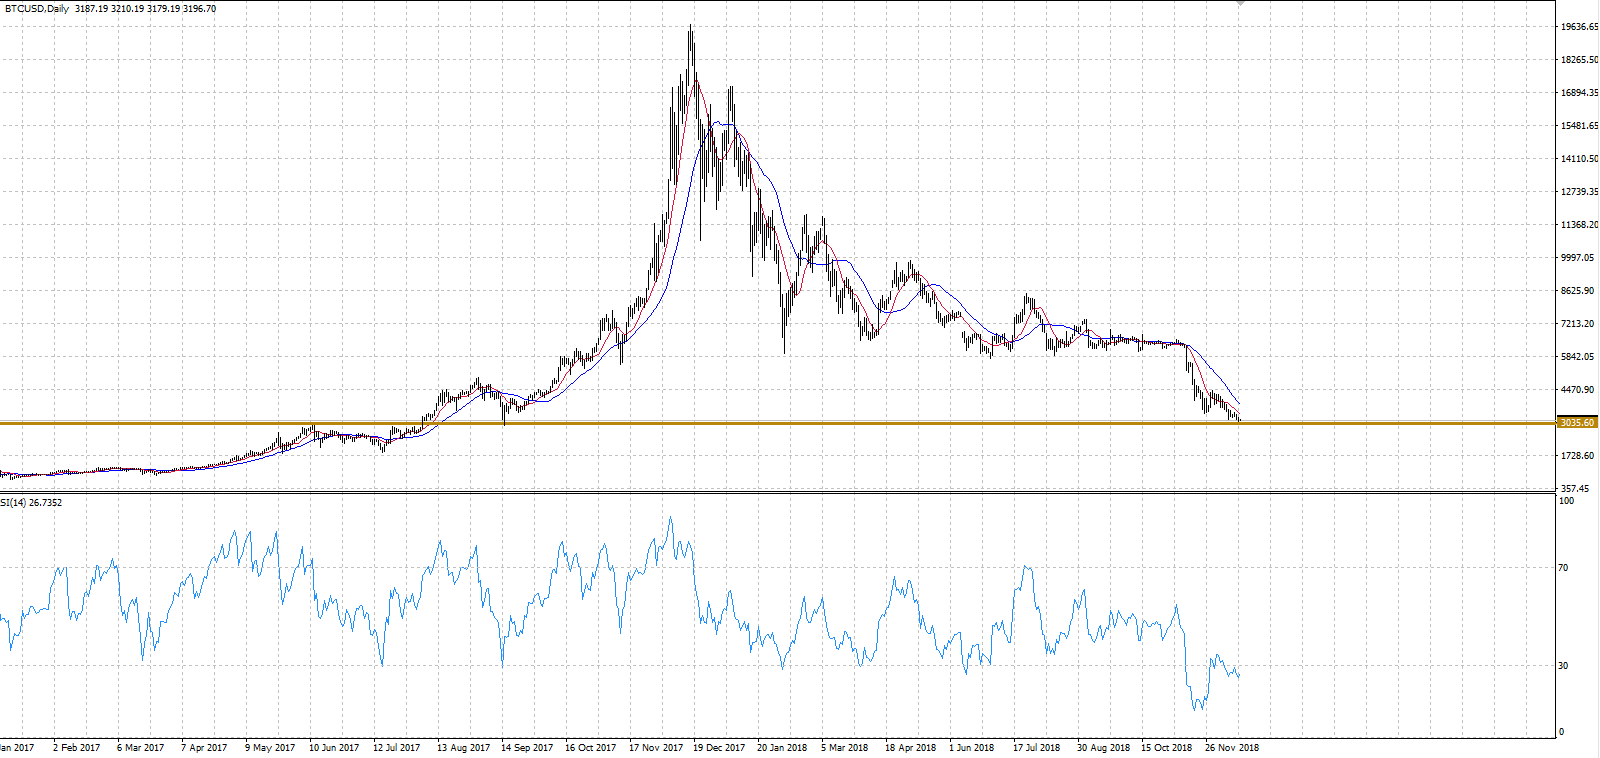
The rally in BTCUSD last year was spurred not by radical innovation, or a regulatory change, but by the herd. A lot of people wanting to believe, and betting on there beliefs. Recently, the belief has seen the volumes of selling reach there lowest since 2015, where BTCUSD traded below $300. However with most markets, the next thought is when will the bleeding stop? “It cannot go down forever”, where is it’s floor? As you can see from the chart above we are current trading at the support $3,035, and using the RSI we see it trading below 30, meaning oversold. Does this mean buyers are nearby? Like a boxing day sale where “70% off” is plastered across displays, and ques outside department stores at 6AM in the morning ready to ransack. On a daily time frame the 10/25 day moving averages show a potential upwards cross, which many see as the potential of a bullish run.

Now as Christmas arrives, and we prepare presents for our loved ones, and tell our children Santa has answered there wish. What about ours? Are we seeing the signs of a future bull run in crypto? With the opportunity at “70% off” its true value? Or will we enter the new year like most kids when they find out Santa doesn’t exist? Like a year ago, although the technicals may point to a pending rally, only the belief of the herd can see this be validated or shutdown. Whatever your view, this could be an interesting one to watch in the next few weeks.


Eliman Dambell

Tradeview Markets


David Ogden – Http://markethive.com/david-ogden
Bitcoin Price Weekly Analysis – BTC’s Short Term Rebound Likely

Bitcoin Price Weekly Analysis - BTC's Short Term Rebound Likely

Bitcoin Price Weekly Analysis – BTC’s Short Term Rebound Likely

Key Points

  • Bitcoin price traded to a new yearly low at $3,126 and later corrected a few points against the US Dollar.

  • There was a break above a key bearish trend line with resistance at $3,220 on the 4-hours chart of the BTC/USD pair (data feed from Kraken).

  • The pair may perhaps correct higher in the short term towards the $3,320 or $3,380 resistance.

Bitcoin price is forming a short term base near $3,120 against the US Dollar. BTC/USD is likely to test the $3,380-3,400 resistance zone before declining once again.


Bitcoin Price Analysis

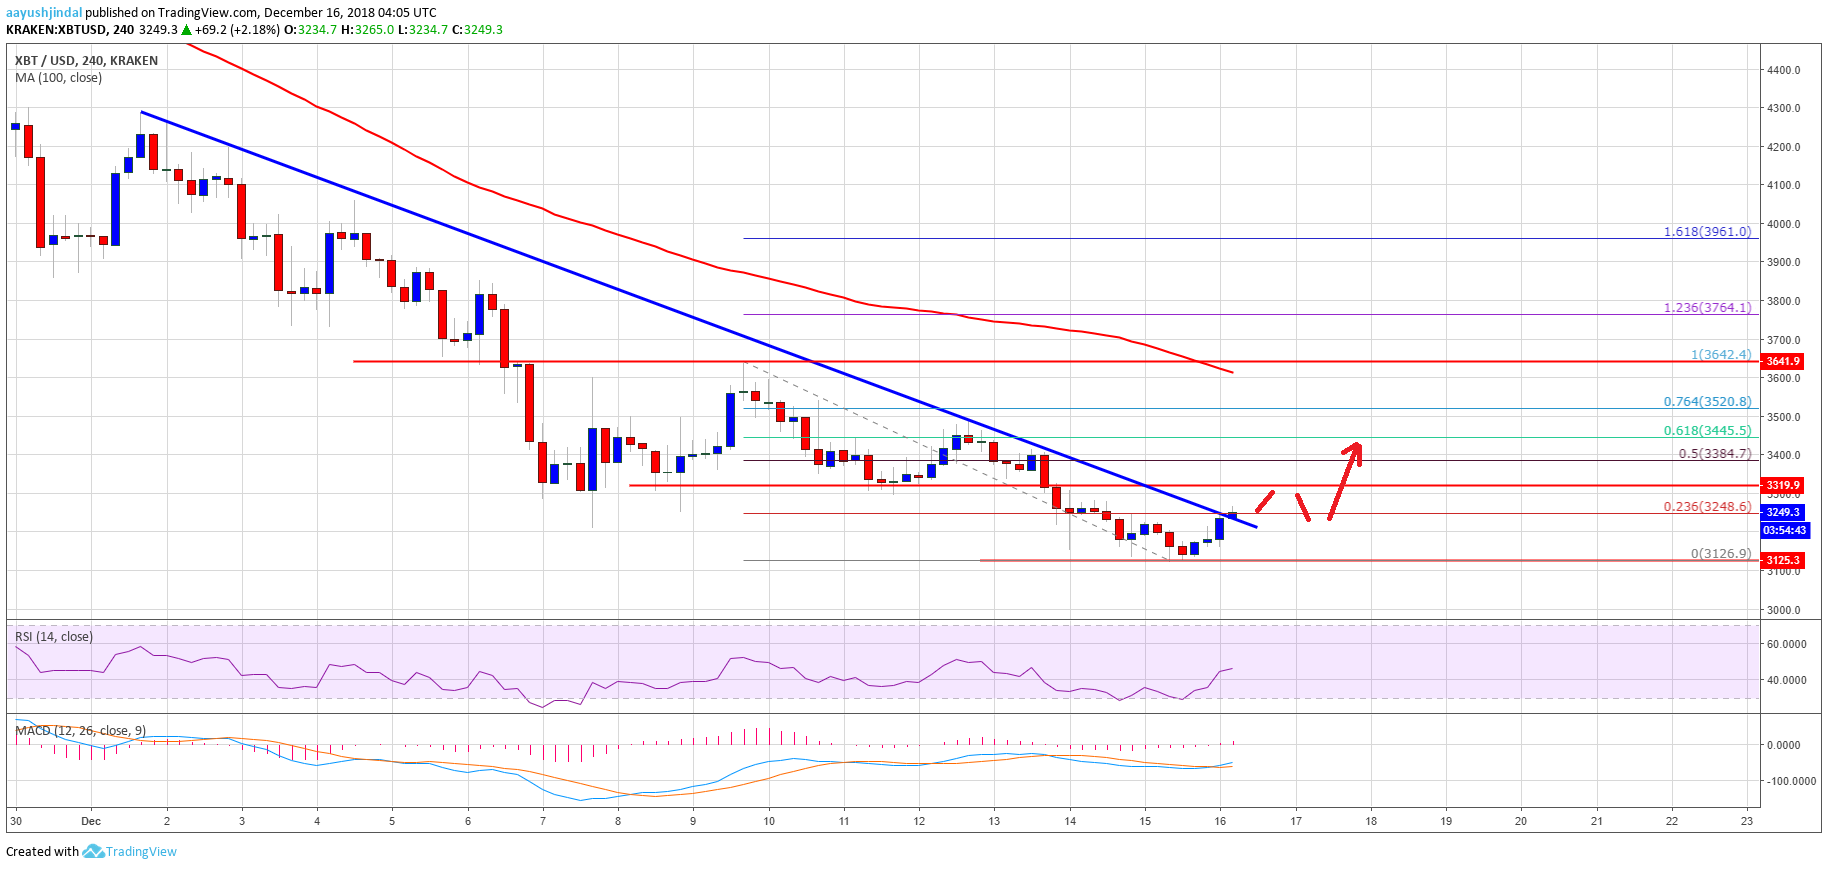
This past week, bitcoin price remained in a slow and steady downtrend from the $3,640 high against the US Dollar. The BTC/USD pair traded lower and broke the $3,400 and $3,320 support levels. The decline gained pace and the price traded to a new yearly low at $3,126. Later, it consolidated above $3,126 for a few sessions before correcting higher. It moved above the $3,200 resistance, but it is well below the 100 simple moving average (4-hours).

During the rise, it almost broke the 23.6% Fib retracement level of the last slide from the $3,642 high to $3,126 low. Moreover, there was a break above a key bearish trend line with resistance at $3,220 on the 4-hours chart of the BTC/USD pair. However, it seems like buyers are struggling to gain pace above the $3,250 level. The first hurdle for buyers is near the $3,320 level (the previous support). The next is $3,380 and the 50% Fib retracement level of the last slide from the $3,642 high to $3,126 low. A successful break above $3,380 and the $3,400 is needed for buyers to gain bullish momentum.

Looking at the chart, BTC price could correct higher towards $3,380, but more upsides won’t be easy. On the downside, the $3,200 and $3,126 levels are decent supports, followed by $3,000.
 

Looking at the technical indicators:

4-hours MACD – The MACD for BTC/USD is slowly moving in the bullish zone.

4-hours RSI (Relative Strength Index) – The RSI is just near the 50 level.

Major Support Level – $3,200

Major Resistance Level – $3,400


AAYUSH JINDAL | DECEMBER 16, 2018 | 5:00 AM

David Ogden – Http://markethive.com/david-ogden
Is Bitcoin dying? Not so fast, Researchers refute predictions of Crypto Market Demise

Is Bitcoin dying? Not so fast, Researchers refute predictions of Crypto Market Demise

Is Bitcoin dying? Not so fast, Researchers refute predictions of Crypto Market Demise

Each time the cryptocurrency market crashes, social media is filled with predictions of BTC slipping to zero and plenty of people saying “I told you so.” 2018’s bear market has caused many to flee from the cryptocurrency space and emboldened people like economist Nouriel Roubini who has been a harsh critic of Bitcoin and altcoins for years.

He’s called Bitcoin the mother of all scams, has referred to the cryptocurrency market as a “sinking cesspool” and just last week he tweeted that The sector is on its last legs. “If it all sounds funereal it is because Bitcoin and all other crypto-currencies are on the way a funeral march!”

Even some known Bitcoin and cryptocurrency advocates have recently made some remarks that could be taken in a negative light. In the last few weeks, Bitcoin bull and billionaire investor Mike Novogratz said that the ICO market was dead and the young crypto millionaire Erik Finman said the digital asset was in trouble.

Despite all the doom and gloom that has resulted from this extended bear market, researchers from the University of Cambridge who took part in the second Global Cryptoasset Benchmarking Study have some positive news regarding the future price of Bitcoin and the overall health of the cryptocurrency market.

They think that cryptocurrency is here to stay and that there are too many planned developments for the market to fall apart now.

“Statements proclaiming the death of the crypto-asset industry have been made after every global ecosystem bubble,” the researchers stated. “While it is true that the 2017 bubble was the largest in bitcoin’s history, the market capitalization of both bitcoin and the crypto-asset ecosystem still exceeds its January 2017 levels–prior to the start of the bubble.”

The study found that the burst bubble might have caused a delay in the development of many projects, but the industry has pushed forward and many projects may make breakthroughs sooner rather than later. “The speculation of the death of the market and ecosystem has been greatly exaggerated, and so it seems likely that the future expansion plans of industry participants will, at most, be delayed.”

As the community awaits institutional powerhouses like Goldman Sachs to enter the scene and projects like Bakkt to cause a flood of billions to rush into the crypto space, many teams continue to work on the useful applications that will actually usher in adoption and bring cryptocurrency to the masses.


By Stephen Brown – December 15, 2018

David Ogden – Http://markethive.com/david-ogden

Bitcoin (BTC) Daily Price Forecast – December 12

Bitcoin (BTC) Daily Price Forecast – December 12

Bitcoin (BTC) Daily Price Forecast – December 12

BTC/USD Medium-term Trend: Bearish

Resistance Levels: $6,800, $6,900, $7,000

Support levels: $3,300, $3,200, $3,100

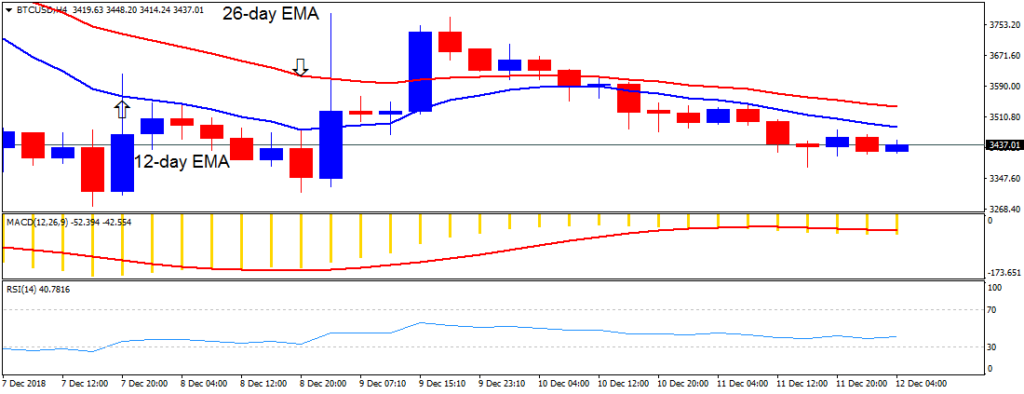
Yesterday, December 11, the price of Bitcoin was in a bearish trend. In the last 48 hours, the price of Bitcoin had been in the bearish trend zone. The crypto's price had been fluctuating above the $3,400 price level. It was suggested that if the bears broke the $3,400 price level, the crypto will resume the downtrend and price is expected to test the $3,000 price level.

Today, the crypto's price is below the EMAs and price is fluctuating above the $3,400 price level. Meanwhile, the MACD line and the signal line are below the zero line which indicates a sell signal. Also, the BTC price is below the 12-day EMA and the 26-day EMA which indicates that price is likely to fall.

BTC/USD Short-term Trend: Bearish

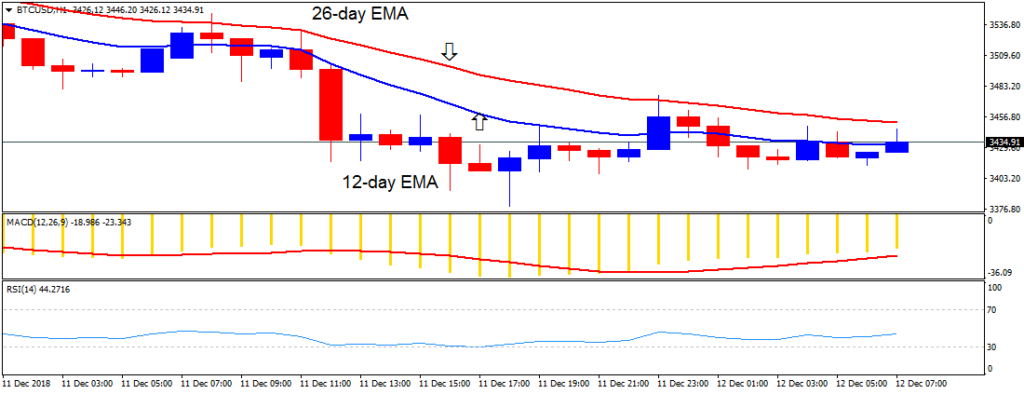
On the 1-hour chart, the price of Bitcoin is in a bearish trend. In the bearish trend of yesterday, the crypto’s price fell to the low of $3,413.3 and commenced a bullish movement on the upside. The bulls broke the 12-day EMA but were resisted by the 26-day EMA and price fell back to the bearish trend zone.

Meanwhile, the price of Bitcoin is below the 12-day EMA and the 26-day EMA which indicates that price is likely to fall. The Relative Strength Index period 14 is level 37 which indicates that price is nearing the oversold region.


By Azeez M – December 12, 2018

David Ogden – Http://markethive.com/david-ogden

Bitcoin price weekly analysis – 11.12.2018

Bitcoin price weekly analysis – 11.12.2018

Bitcoin price weekly analysis – 11.12.2018

Bitcoin price continued on plummeting throughout last week’s trading sessions, recording a week low of $3,277 last Friday. However, after the week low was recorded, the market began recovering slightly and the bulls managed to push bitcoin price above $3,600 on Sunday. Despite the 14% drop we witnessed last week, the market’s bears failed to pull bitcoin price below $3,192, which represents a critical support level, as per the current market conditions. If bitcoin price continues on recovering during the upcoming week, it won’t face significant resistance except near $4,282, which corresponds to the 76.4% Fibonacci retracement level.

Bitcoin price and the news:

In another disappointing week for cryptocurrency enthusiasts, the price of bitcoin continued on dropping to record a new low during 2018. As such, bitcoin price lost more than 50% of its market capital in less than a month. The bearish wave also affected Ripple (XRP), Stellar (XLM), Ethereum (ETH), EOS, Litecoin (LTC), and Bitcoin Cash (BCH), which witnessed 10-20% price drops during last week’s trading sessions.

Last week, the SEC announced that they are to postpone the ruling of Bitcoin’s ETF until late February. This did not help boost the confidence of crypto investors who seem to be reaching a point of capitulation.

The Bitcoin Network overall hash rate continued on dropping throughout the previous week. Bitcoin’s hash rate has been dropping since the beginning of November, even though it has been steadily rising all through 2018, recording historical highs last August. The reasons behind this decline include:

– Shutting down of mining operations by the Chinese government

– Hash power of mining facilities being redirected away from bitcoin to mine other cryptocurrencies

– Decline of mining profitability forced a considerable percentage of miners to cease mining operations entirely.


Red Ichimoku Cloud on the 1 day BTCUSD chart:

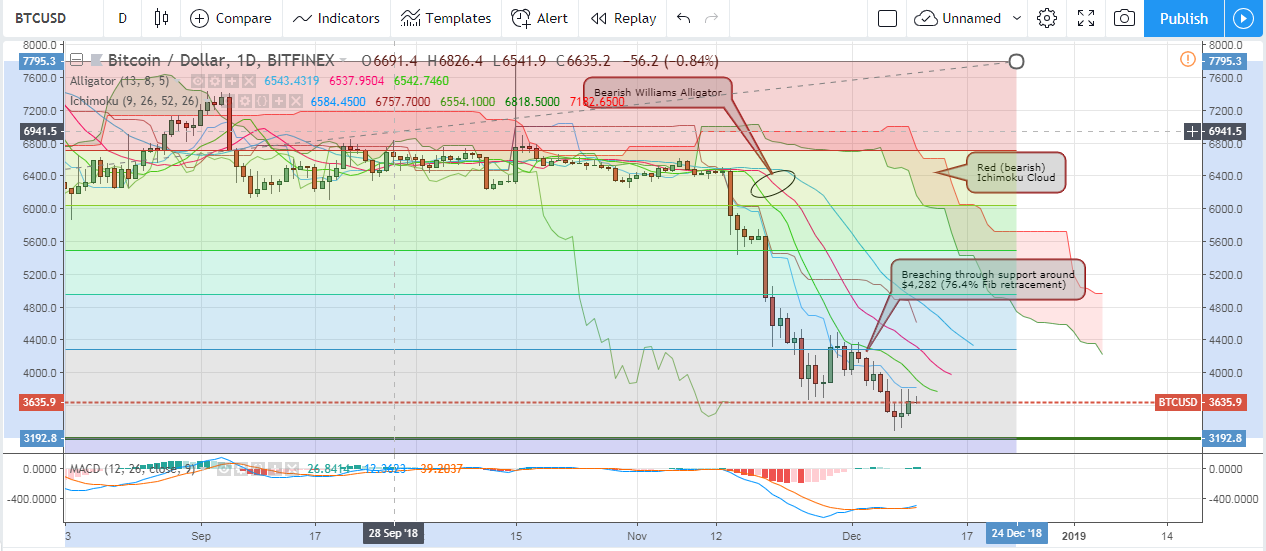
Let’s examine the 1 day BTCUSD chart from Bitfinex, while plotting the Ichimoku Cloud, the Williams Alligator’s SMAs, and the MACD indicator, as shown on the below chart. We can note the following:

– To identify key resistance and support levels as per the current market, we will plot Fibonacci retracements extending between a low of $3,192 and a high of $7,758. Last week, bitcoin price dropped significantly, after the market’s bears managed to breach the support level around $4,282, which corresponds to the 76.4% Fibonacci retracement. Now, the next significant support level lies around $3,192. Last week, bitcoin price began recovering after a low of $3,277 was recorded, which is around $90 higher than the critical support level around $3,192. On the upside, the market’s bulls will face significant resistance around $4,282 (previous support turns into resistance).

– The Ichimoku Cloud is exhibiting multiple bearish signals, which denotes that bitcoin price is most likely to continue on dropping during the upcoming week. The Ichimoku Cloud is red. Bitcoin price is way below the cloud (bearish signal). Also, the Conversion Line (blue line) has crossed below the Base Line (red line), which represents another bearish signal.

– The Williams Alligator’s SMAs are exhibiting a bearish alignment, as the teeth (red SMA) is between the jaw (blue SMA) from above, and the lips (green SMA) from below.

– The MACD indicator is in the negative territory, yet the blue MACD line has crossed above the red signal line.


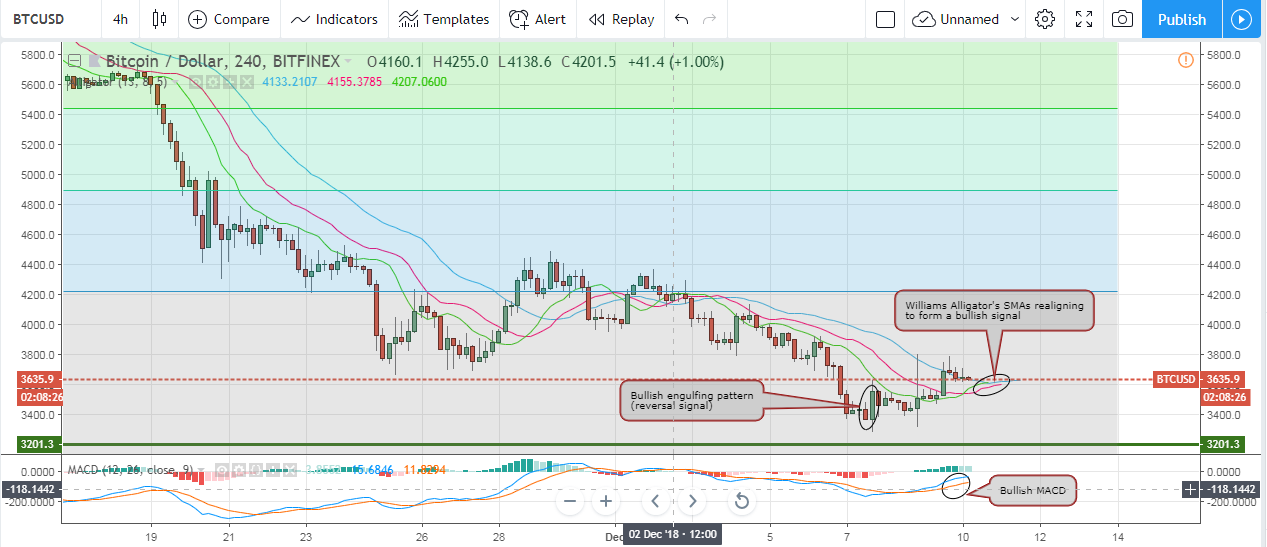
Bullish reversal signs on the 4 hour BTCUSD chart:

Now, let’s examine the 4 hour BTCUSD chart from Bitfinex, while plotting the Williams Alligator’s SMAs and MACD indicator. We will also keep the Fibonacci retracements we extended on the 1 day chart, as shown on the below chart. We can note the following:

– Right after the week low was recorded, a “bullish engulfing” candlestick pattern was formed on the chart (the pair of candlesticks highlighted by an ellipse on the above chart). This candlestick pattern serves as a bullish reversal signal denoting that bitcoin price can recover and attempt rising towards $4,282 during the upcoming week.

– Even though the Williams Alligator’s SMAs have been exhibiting a bearish alignment since the beginning of December, this alignment began to change on Sunday to form a bullish alignment. This serves as a bullish reversal signal that denotes that the bears are losing their market grip.

– The MACD is bullish. The MACD blue line has crossed above the signal red line and both are sloping in an upwards direction, which represent another bullish reversal signal.
 

Conclusion:

Bitcoin price continued on dropping during last week’s trading sessions. Even though the 1 day BTCUSD charts are still exhibiting multiple bearish indicators, analysis of the 4 hour BTCUSD charts shows multiple bullish reversal signals that indicate that bitcoin price is likely to recover during the upcoming week.


POSTED BY: TAMER SAMEEH DECEMBER 11, 2018

David Ogden – Http://markethive.com/david-ogden
Bitcoin Price Recovers 12% in 72 Hours While Traders Remain Cautious in Short-Term

Bitcoin Price Recovers 12% in 72 Hours While Traders Remain Cautious in Short-Term

Bitcoin Price Recovers 12% in 72 Hours While Traders Remain Cautious in Short-Term

ince December 8, the Bitcoin price has increased from $3,210 to $3,588, by just about 12 percent against the U.S. dollar.

In the same time frame, the cryptocurrency market added $11 billion to its valuation, avoiding a further drop below the $100 billion mark, which could have been critical for the short-term trend of the market.

Most major cryptocurrencies including Ethereum (ETH) and Bitcoin Cash (BCH) have been able to rebound from low double digits, as technical indicators started to demonstrate extremely oversold conditions.

But, traders and technical analysts remain cautious towards the short-term price trend of cryptocurrencies until major resistance levels are broken.

$3,700 For Bitcoin

Since early December, the value of Bitcoin has continuously fallen from the mid-$4,000 region, struggling to maintain its momentum and show any sign of stability.

According to DonAlt, a prominent cryptocurrency technical analyst, until Bitcoin breaks out of the $3,700 resistance level, it will remain in a tight range between $3,300 to $3,600, unable to engage in a major price movement.

The analyst said:

“Another good day for BTC. That said it’s still nowhere close to turning bullish on the higher time frames. While the low timeframes look decent, BTC hasn’t even reclaimed the previous trading range. Until it does, no swing long trades.”

As Alex Krüger, an economist and a cryptocurrency trader, recently emphasized, BTC is in a significantly better position to enter an accumulation phase and a consolidation period because it has been able to minimize its loss during several steep market sell-offs.

When compared to both Ethereum and Bitcoin Cash, Bitcoin has kept its value fairly well given the intensity of the market crash throughout the past two months.

ETH and BCH have recorded 93 percent and 95 percent losses respectively against the U.S. dollar, and BTC would have to drop another 72 percent from the current price range to experience a similar drop as the two digital assets.

“Performance from all-time-highs to date, for the main cryptoassets: BTC -82%, XRP -86%, ETH -93%, BCH -95% (using Bitfinex’s data). These may all look equally bad. It is not so. The difference between -82% and -95% is a further 72% drop,” Krüger explained.

Market Still Nervous

Several analysts have reaffirmed that as long as the dominant cryptocurrency remains below $3,700 and struggles to demonstrate a major breakout, the market is at risk of dropping to a new yearly low.

Historically, the cryptocurrency market has taken around 67 weeks on average to recover from a large correction and achieve a new all-time high.

While positive developments like the Nasdaq, Bakkt, and NYSE futures markets are around the corner and are expected to launch in the first quarter of 2019, it could easily take until the second quarter of next year for the cryptocurrency market to begin its recovery.

A proper bottom has not been established by BTC and other major cryptocurrencies, as well as small market cap ERC20 tokens, have not shown any signs of a large corrective rally.

Featured Image from Shutterstock. Charts from TradingView.

POSTED IN: BITCOIN PRICE NEWS, NEWS

AUTHOR

Joseph Young

David Ogden – Http://markethive.com/david-ogden
Bitcoin to rise to $333,333, following a $2,500 imminent bottom: Bobby Lee

Bitcoin to rise to $333,333, following a $2,500 imminent bottom: Bobby Lee

Bitcoin to rise to $333,333, following a $2,500 imminent bottom: Bobby Lee

Bobby Lee, the co-founder of the Hong-Kong based cryptocurrency exchange BTCC and a board member of the Bitcoin Foundation, has predicted that Bitcoin [BTC] could skyrocket to $333,333, after it plummets to a bottom of $2,500.

Lee expects the bears to continue to torment the cryptocurrency market, leading to a fall of 27.4 percent against the current BTC price, dropping down to $2,500 by January 2019, its lowest point since July 2017.

He further stated that the next upswing would begin in late 2020, achieving an unprecedented high of $333,333 by December 2021 following another market crash to $41,000 by January 2023.

If history repeats perfectly, then the current bear market for #Bitcoin would bottom out at $2,500 next month, in Jan 2019.

And then the next rally would start in late 2020, peak out in Dec 2021 at $333,000, and then crash back down to $41,000 in Jan 2023.

Something like that????? https://t.co/M8ljIVnt73

— Bobby Lee (@bobbyclee) December 7, 2018

Basing his chronological prediction on the market trends, as far back as December 2013, when Bitcoin reached an all-time high of close to $1,200, before settling back down to under $300 by 2015. As Bitcoin approached 2017, the top crypto held well over 80 percent of the entire virtual currency market.

Investors began to notice the dominance of cryptocurrency in early 2017, when the coin’s price broke the $1,000 mark in January and the $3,000 in the next eight months, following which it soared to as high as $19,000 during the infamous December 2017 bull-run.

On a year-to-year basis, Bitcoin has dropped by 82.57 percent from its highest valuation of $19,783 in December to its current price of $3,447. The cryptocurrency markets, which has a 54 percent Bitcoin stake currently, has felt the brunt of the Bitcoin collapse, falling by over $100 billion in a month since the beginning of November.

Crypto-proponents were gunning for a December 2018 bull run mimicking the previous year, but were taken aback by the November meltdown, triggered by Bitcoin Cash. Mike Novogratz of Galaxy Investment Partners predicted a rally at the end of 2018, pushing Bitcoin up to $8,700. At press time, the coin has fallen by 60.3 percent from the aforementioned prediction to the current price $3,447.

Tom Lee, the head of research at Fundstrat Global Advisors in mid-November during the peak of the crash, affirmed his earlier prediction that Bitcoin would reach $15,000 by the year’s end. Lee pegged his hopes on investors viewing the virtual currency, not as a “commodity,” but as an “emerging asset class.”


By aakash

Dec 08?2018 11:17 AM

David Ogden – Http://markethive.com/david-ogden
Bitcoin Price Analysis – BTC/USD Another Day, Another Breakdown

Bitcoin Price Analysis - BTC/USD Another Day, Another Breakdown

Bitcoin Price Analysis – BTC/USD Another Day, Another Breakdown

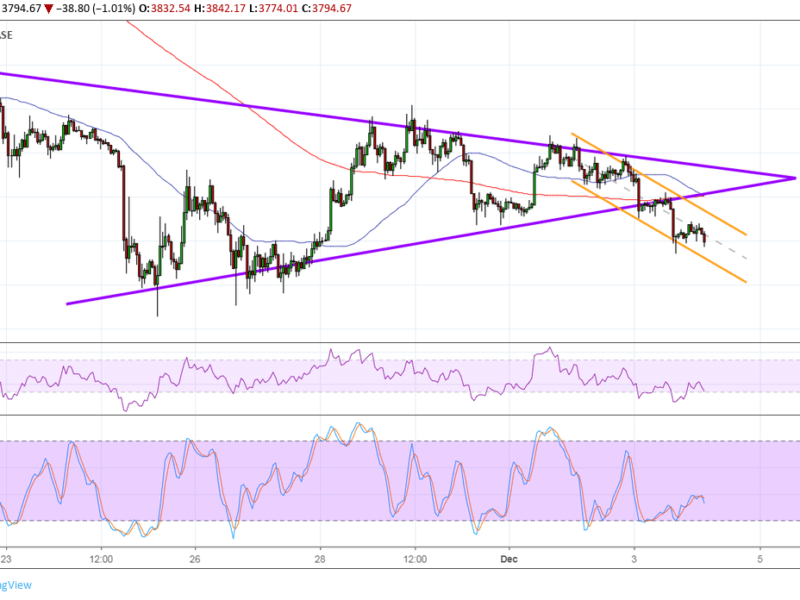
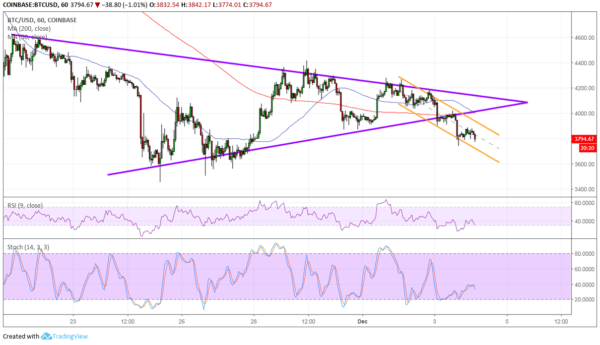
Bitcoin previously consolidated inside a symmetrical triangle to pause from its selloff, but it looks like bears are still in control. Price broke below the triangle bottom at $4,000 major psychological level to signal that another slide is in the works.

The 100 SMA is starting to cross below the longer-term 200 SMA as additional confirmation of bearish pressure. However, RSI seems ready to climb out of the oversold region to indicate that buyers might take over while sellers take a break. Similarly stochastic is moving north so bitcoin could follow suit.

Bitcoin is also trending inside a small descending channel and is bouncing off the bottom. A pull back to the top might be due before sellers return again. This lines up with the broken triangle support that might now hold as resistance and also the moving averages dynamic inflection points.

Bitcoin has given way to FUD once more as last week’s updates didn’t seem enough to sustain any recoveries. As it is, more and more media outlets continue to cover the bloodbath and are likely convincing more holders to liquidate. Recall that revived focus on institutional investments allowed bitcoin to pause from its sell off and many hoped that it could be followed by an even larger bounce.

Traders might have been able to digest the latest SEC commentary on how the lack of consumer protection measures in the crypto market means that they’re not likely to approve any bitcoin ETF applications anytime soon. This puts the industry a huge step back as it would mean other altcoins would have to wait much longer.

Bulls are also likely holding out for bigger developments instead of mere speculations. For now, it looks like the slide could carry on until actual evidence of a pickup in volumes from institutional investors early next year are seen.


SARA JENN · DECEMBER 4, 2018 · 12:30 AM

David Ogden – Http://markethive.com/david-ogden
Bitcoin bulls ask, where’s the bottom?

Bitcoin bulls ask, where's the bottom?

Bitcoin bulls ask, where's the bottom?

  • Bitcoin lost 37 pct in the month of Nov.

  • The bottom not yet in sight as bulls scramble for stability.

Bitcoin, the largest cryptocurrency by market capitalisation and the coin that gave blockchain to the world, has lost 37 percent of its value in the month of November, has still not been able to find a stable bottom, as the prices fell back again after rallying back above $4,000 during the week.

BTC/USD is down nearly one percent on day at $3,942, but trading in less than 0.3 percent range for the day, thanks to lower volumes and resulting in lower volatility for the crypto whose second cousin is volatility.

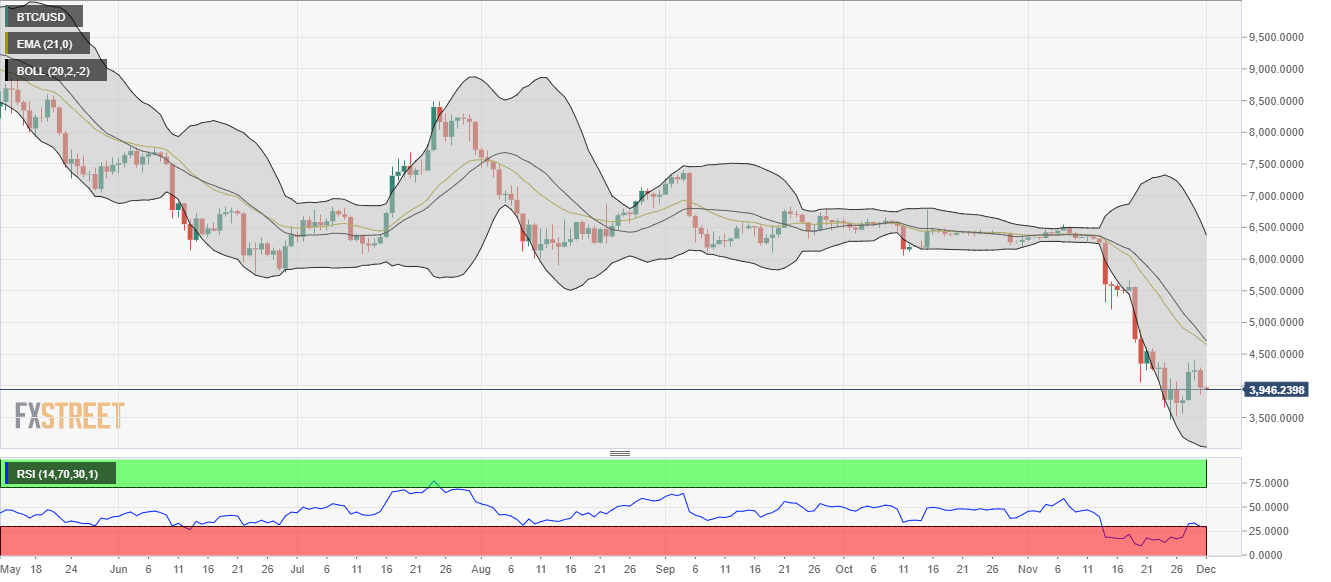
A quick look at various time-frames of the chart reveals us that although volatility has come down a but after November sell-off, by no means a long term meaninful bottom has been placed yet. BTC may well touch and even break recent lows and head towards $3,000 as mentioned last week. (Read here) Even as experts such as Morgan Creek Capital Management's CEO, Mark Yusko, believe that there is long term value for the largest coin and bottom should be somewhere around the corner.

BTC/USD daily chart:

Manoj B Rawal

FXStreet


David Ogden – Http://markethive.com/david-ogden

Bitcoin Prices Soar -Nasdaq to Launch Bitcoin Futures in Q1 2019

Bitcoin Prices Soar -Nasdaq to Launch Bitcoin Futures in Q1 2019

Bitcoin Prices Soar -Nasdaq to Launch Bitcoin Futures in Q1 2019

Investing.com – Bitcoin and other major digital coins’ prices all traded higher on Thursday in Asia on news that Nasdaq is set to introduce Bitcoin futures in the first quarter of next year. ?

Bitcoin jumped 6.55% to $4,187.5 by 09:31 PM ET (02:31?GMT) on the?Investing.com index.?Ethereum added 4.49% to $118.77 and XRP gained 2.48% to $0.37633?on the?Poloniex?exchange.???

1337/LTC?also advanced?8.68% to $33.550?on the?Bitifinex?exchange.?

Bitcoin regained a bit of momentum following a second low this week. The most traded digital coin dropped below $3,800 in mid-week before bouncing to this week’s peak at $4,395 on early Thursday morning.

However, Bitcoin remains trading 30% less of its value since mid-November, when the digital coin dropped from above $6,500.

On Thursday, media reported that Nasdaq is set to launch bitcoin futures in the first quarter of 2019 despite the current bearish sentiment for cryptocurrencies.

Bitcoin futures will provide investors with a centralized marketplace where participants can speculate on the future price movements of Bitcoin.

Nasdaq has reportedly been working closely with the Commodities Futures Trading Commission (CFTC) to secure regulatory approval for its proposed Bitcoin futures launch together with investment management firm VanEck.

Gabor Gurbacs, VanEck's director of digital asset strategy, said the firm "ran a few extra miles working with the CFTC to bring about new standards for custody and surveillance."

Nasdaq is not the first one to enter the digital currency space. The CFTC has so far approved two crypto futures products. One is from the Chicago Board Options Exchange and another from the Chicago Mercantile Exchange.

Nasdaq showed interest in tapping into the crpyto space earlier. In April, its CEO Adena Friedman told media that “certainly Nasdaq would consider becoming a crypto exchange over time.”


David Ogden – Http://markethive.com/david-ogden