Bitcoin BTC Price Fails to Hold Above Weekly Close 5 Mln Longs Liquidated on BitMEX

Bitcoin [BTC] Price Fails to Hold Above Weekly Close, $5 Mln Longs Liquidated on BitMEX

Bitcoin [BTC] rose $200 on Sunday as price broke above $9000. The psychological positive move along with green across the entire crypto market raises the sentiments of most traders towards the year-end.

However, it fails to hold the bullish psychological as the price has fallen back to $8950 levels. The price of Bitcoin [BTC] at 4: 30 hours UTC on 11th November 2019 is $8955.

Bitcoin Weekly Close

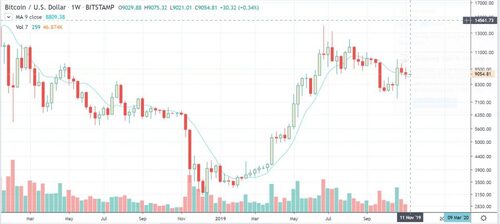
On a weekly scale, even after the positive move, BTC price closed on a red. According to Tone Vays, the weekly chart looks neutral, however, on a bearish count according to sequential analysis.

Similarly, on a daily scale as well, the 200-Day inability to break above the 200-Day Moving average brings it closer to a death cross with the 128-Day moving average.

He cites that the resistance for a bullish break-out this week out would be around $9600.

BTC/USD Weekly Chart on Bitstamp (TradingView)

Another Gap Fills on CME on the 4-Hour

The change in the price of Bitcoin over the weekend often creates a substantial gap with CME. As CME is one of the largest regulated exchanges for Bitcoin futures, it has a considerable effect on Bitcoin prices.

Moreover, with Bitcoin, it generally has a tendency to fill the price gaps with CME. The difference was about $215, as Bitcoin closed at $8885 on Friday. With the correction on Monday to about $8950 as filled most of the gap.

Moreover, the volume of the break was also not enough to justify a massive bullish breakout.

Bulls Still Scared of the Bears?

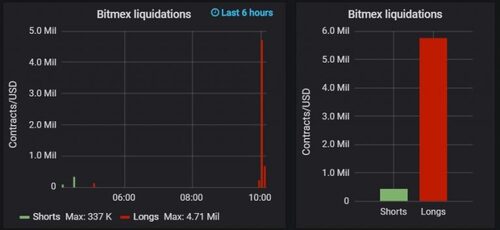
The bullish turn was accepted by the market contently as traders moved further long. Only a small percentage of short liquidations were noticed signaling a bullish inclination.

However, since Bitcoin fails to maintain the levels, about $5 million worth Bitcoin longs liquidates on BitMEX in less than 2 hours.

Bitfinex and BitMEX liquidations (Source)

Technically, Bitcoin is not out of the clutches of the bears. First and foremost, the 200-Day Moving Average continues to act as resistance and is now rising, currently at $9240.

The market sentiments are largely bullish with December futures contracts selling at $9075 and a high long/short ratio on spot exchanges. The funding rate on BitMEX and Bitcoin basis on Okex is also positive with large magnitudes signaling strong bullish inclination. However, there is still a lack of momentum at the moment.

Do you think the strong bullish inclination is justified or bears are still strong? Please share your analysis with us.


Nivesh Rustgi Bitcoin News 1 min ago

David Ogden – Http://markethive.com/david-ogden

Bitcoin BTC Price Weekly Forecast – More Downsides Likely

Bitcoin (BTC) Price Weekly Forecast – More Downsides Likely

  • After consolidating above $9,000, bitcoin declined heavily against the US Dollar.

  • The price is currently trading in a bearish zone, with a close below $9,000 and $8,920.

  • There was a break below a major contracting triangle with support near $9,180 on the 4-hours chart of the BTC/USD pair (data feed from Kraken).

  • The price is currently showing bearish signs and it could decline further towards $8,560 or $8,300.

Bitcoin price is trading in a downtrend below $9,000 against the US Dollar. BTC remains at a risk of more downsides towards $8,300 in the near term.

Bitcoin Price Weekly Analysis (BTC)

In the past few days, bitcoin consolidated in a range above the $9,000 support against the US Dollar. However, the bulls failed to protect losses, resulting in a downside break below the key $9,000 support area.

Additionally, there was a break below the 50% Fib retracement level of the upward move from the $7,317 low to $10,578 high. More importantly, there was a break below a major contracting triangle with support near $9,180 on the 4-hours chart of the BTC/USD pair.

It opened the doors for more losses below the $8,920 support and the 100 simple moving average (4-hours). The decline was strong and bitcoin even settled below the $8,800 level.

At the moment, the price is consolidating below the $9,000 and $8,900 levels. An immediate support is near the $8,600 and $8,560 levels. Moreover, the 61.8% Fib retracement level of the upward move from the $7,317 low to $10,578 high is near the $8,560 level.

If there are more downsides, the price could slide towards the $8,330 and $8,300 support levels. The mentioned $8,300 area acted as a resistance earlier and now it is likely to provide support.

Any further losses may push the price towards the $8,080 support. It represents the 76.4% Fib retracement level of the upward move from the $7,317 low to $10,578 high.

On the upside, the recent support area near the $9,000 level could act as a resistance. Besides, the 100 simple moving average (4-hours) is a major hurdle near the $9,100 level. Therefore, a successful close above $9,100 is needed for more gains in the near term.

Bitcoin Price


Looking at the chart, bitcoin price is clearly trading in a bearish zone below the $9,000 support and the 100 simple moving average (4-hours). Thus, there are high chances of more losses towards the $8,560 support or $8,300 pivot area.


Technical indicators

4 hours MACD – The MACD for BTC/USD is slowly losing pace in the bearish zone.

4 hours RSI (Relative Strength Index) – The RSI for BTC/USD is now well below the 40 level.

Major Support Level – $8,560

Major Resistance Level – $9,100


Aayush Jindal

David Ogden – Http://markethive.com/david-ogden

China Scraps Plan to Ban Crypto Mining – Bullish for Bitcoin

China Scraps Plan to Ban Crypto Mining – “Bullish for Bitcoin”

Close on the heels of Chinese President Xi Jinping’s endorsement of blockchain technology, the Chinese government has scrapped its plans to ban cryptocurrency mining. Now, Bitcoin mining will not face a state crackdown in China.

The news marks a major positive for Bitcoin-related activities in China, a country where cryptocurrency outside the control of the central bank remains all but banned. This somersault in the Chinese government’s policy on cryptocurrency is quite interesting as China has for long been known as a somewhat anti-Bitcoin country. It has made countless efforts to throw off the Bitcoin community in the country, even going as far as banning mining and other crypto-related activities.

However, things seem to be changing slowly as the country seems to not just be in support of blockchain technology, but has also decided that it will not frustrate the Bitcoin mining industry.

Some months ago, the China National Development and Reform Commission (NDRC) proposed a list of industries in the country that should be disallowed from continuing its regular activities and on that list at the time, Bitcoin mining was included. Now, about 6 months later, the newly published Industrial Structure Adjustment Guidance Catalog from the NDRC, conspicuously omits crypto mining.

Interestingly, the latest news on cryptocurrency news comes after China’s President Xi Jinping publicly declared support for blockchain technology, urging the general public to embrace the technology and all that it offers. Ever since the president’s endorsement, China has been come a lot more pro-blockchain and has published lists of hundreds of registered blockchain projects in the country.

Furthermore, the country has also concluded a new cryptography law which is expected to take effect from January 2020. The law will monitor and guide the growth of the sector in the country, but also make sure that no blockchain project gets in the way of national security or ever threatens the sovereignty or power of the state.

China has been developing its own Central Bank Digital Currency (CBDC) and is set to release it to the public. Although no launch date has been publicized so far, China will very likely be the first country to float its digital currency.


Published by Victoria Kyle at November 7, 2019

David Ogden – Http://markethive.com/david-ogden

Bitcoin And Crypto Market Cap Eye Next Break – BCH XLM EOS TRX Analysis

Bitcoin And Crypto Market Cap Eye Next Break – BCH, XLM, EOS, TRX Analysis

  • The total crypto market cap is currently consolidating in a range above the $232.0B support area.

  • Bitcoin price is holding the $9,200 support area, but it is also facing hurdles near $9,400.

  • BCH price is currently correcting lower after it failed to break the $300 resistance.

  • EOS price is consolidating near $3.500 and it could correct lower towards $3.400.

  • Stellar (XLM) price is climbing higher once again and it might test the $0.0800 resistance.

  • Tron (TRX) price is facing a strong resistance near the $0.0200 zone.

Bitcoin (BTC) and the crypto market cap are approaching the next key break. Ethereum (ETH), BCH, stellar (XLM), ADA, EOS, ripple, and tron (TRX) are correcting lower.

Bitcoin Cash Price Analysis

Recently, BCH price climbed higher above the $295 level against the US Dollar. The price tested the $305 resistance area, where it faced a strong selling interest. As a result, the price started a downside correction below the $300 and $295 level.

On the downside, the key support is near the $285 and $280 levels. If there are more downsides, the price could test the $265 support area.

Stellar (XLM), EOS and Tron (TRX) Price Analysis

EOS price struggled near the $3.700 resistance area. As a result, there was a downside correction below the $3.650 level. The price is currently consolidating near $3.500 and it seems like it could correct lower further towards the $3.400 support area. On the upside, the main hurdles are near the $3.650 and $3.700 levels.

Stellar price corrected gains after a sharp rally towards the $0.0880 resistance area. XLM price declined and tested the $0.0700 support area. It is once again moving higher towards the $0.0800 resistance. If there are more upsides, the price may perhaps test the $0.0820 level.

Tron price struggled to stay above the $0.0200 support area and recently corrected lower. TRX price tested the $0.0195 support and it is currently consolidating in a tiny range. If there is an upside break above $0.0200, the price is likely to resume its upward move.

Crypto Market Cap

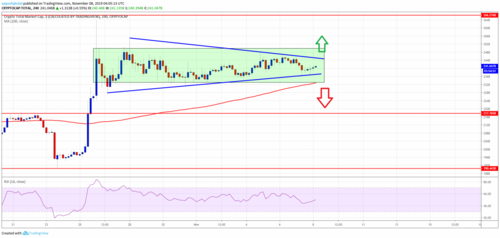
Looking at the total cryptocurrency market cap 4-hours chart, the $250.0B resistance zone acted as a crucial barrier for more upsides. As a result, the market cap declined and it is now consolidating in a range above the $232.0B support area. If there is a downside break, the market cap could retest the $215.0B support.

Conversely, an upside break above the $250.0B resistance is likely to spark a strong rise in bitcoin, Ethereum, EOS, ripple, litecoin, bitcoin cash, XLM, TRX, BNB, WAN, WTC, ICX, and other altcoins in the near term.


Aayush Jindal

David Ogden – Http://markethive.com/david-ogden

Bitcoin price prediction – Why 9600 must be brought down for BTCUSD rise to 10000? Confluence Detector

Bitcoin price prediction – Why $9,600 must be brought down for BTC/USD rise to $10,000? – Confluence Detector

  • Bitcoin forms a narrow range within a wider range making recovery a hard nut to crack.

  • The limited support means that declines will have far-reaching effects.

  • The most prominent resistance at $9,353 must be broken for gains towards $10,000.

  • The mundane trading activity is still at its best even as the week’s trading nears its end. Bitcoin is still trading within a wide range between $9,000 and $9,600. Moreover, the trend in the last two days has seen the crypto form a new narrow range between the wider range, $9,300 – $9,500. Meanwhile, the prevailing trend has an inclination towards the lower range limits leaving levels towards $9,600 in bearish dominance.

Bitcoin price confluence levels

Resistance and support levels are important indicators for traders as well as investors. FXStreet’s Confluence Detector tool assists in grouping indicators that form solid resistance and support zones. For instance, Bitcoin is trading at $9,297 after correcting from an intraday high of $9,353. Advances made above $9,300 will come face to face with acute selling resistance at $9,353. This is the most prominent resistance zone and is home to the previous high 15-minutes, previous high 1-hour, Bollinger Band 4-hour middle, SMA 50 1-hour BB 15-mins upper and Fibo 38.2% 1-day among others.

If the bulls manage to clear this level before the weekend, then we are looking at Bitcoin trading above $9,740 (next resistance target) before Monday next week.

On the other hand, initial support is highlighted at $9,256. The indicators converging here are the SMA 50 4-hour, pivot point one-day support one, SMA 200 1-hour and previous low one-day. Bitcoin has limited support areas, therefore focus should be put on scaling the levels towards $10,000.


John Isige

FXStreet

David Ogden – Http://markethive.com/david-ogden

Bitcoin And Crypto Market Could Rise Steadily – BCH Tron XLM ADA Analysis

Bitcoin And Crypto Market Could Rise Steadily – BCH, Tron, XLM, ADA Analysis

  • The total crypto market cap is holding a key support near the $240.0B and $238.0B levels.

  • Stellar (XLM) price surged in the past few days and settled above the $0.0800 resistance.

  • Bitcoin cash price is up more than 2% and it is approaching the $300 resistance area.

  • Tron (TRX) price is currently correcting lower and it is approaching the $0.0195 support.

  • Cardano (ADA) price is slowly rising and it could soon test the $0.0460 and $0.0475 resistances.

The crypto market cap and bitcoin (BTC) are rising steadily. Ethereum, BCH, ripple, stellar (XLM), EOS, TRX, and cardano (ADA) might climb higher.


Bitcoin Cash Price Analysis

After a downside correction, BCH price found support near the $280 and $285 levels against the US Dollar. The price is now moving higher and it is trading above the $295 level. It seems like it could soon surpass the $300 resistance and climb towards the $320 level in the near term.

On the downside, an initial support is near the $292 level. However, the main support for the bulls is near the $285 and $280 levels.

Stellar (XLM), Tron (TRX) and ADA Price Analysis

Stellar price rallied in the past few days and surged above the $0.0720 and $0.0750 resistance levels. XLM price even settled above the $0.0800 resistance and it is currently consolidating gains. An initial support is near the $0.0805, followed by the main $0.0800 level. On the upside, the key resistances are near the $0.0820 and $0.0832 levels.

Tron price is currently correcting lower and it recently traded below the $0.0200 support. TRX price may soon test the $0.0195 support area, where the bulls are likely to take a stand. On the upside, a clear break above the $0.0205 resistance might push the price towards the $0.0220 level.

Cardano price is holding gains above the $0.0420 level and it is slowly climbing higher. An initial resistance is near the $0.0445 and $0.0450 levels, above which ADA price could accelerate gains towards the $0.0475 level. On the downside, there are supports near $0.0420 and $0.0412.

Crypto Market Cap


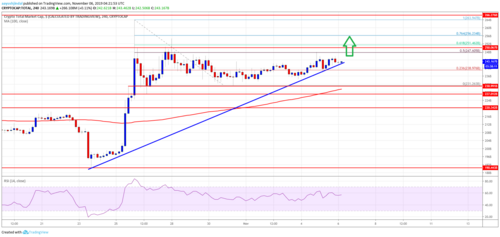
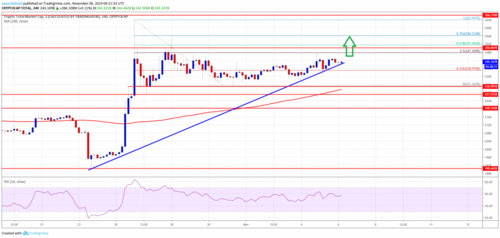
Looking at the total cryptocurrency market cap 4-hours chart, there are positive signs above the $240.0B and $238.0B support levels. There is also a connecting bullish trend line forming with support near the $240.0B level. Therefore, a downside break below the $238.0B level could push the market cap back towards the $230.0B support area.

If not, there are chances of more gains in bitcoin, Ethereum, EOS, stellar, LTC, ADA, EOS, ripple, TRX and other altcoins in the near term. On the upside, the main hurdles for the crypto market cap are near $250.0B and $255.0B.


Aayush Jindal

David Ogden – Http://markethive.com/david-ogden

BITCOIN REVOLUTION -Is it legit or a scam?

BITCOIN REVOLUTION – Is it legit or a scam?

Bitcoin Revolution is an investment scheme that has been operating online for several years and, despite the growing number of warnings, there are still plenty of people around the world who think that it just might be for real.

Anyone who has spent time in the crypto trenches knows to stay away from Bitcoin Revolution, but that hasn’t stopped less savvy people from falling prey to its claims of earning massive profits for a minimal investment.

Interest in the investment scheme appears to be especially pronounced in Australia and Europe, where searches for ‘bitcoin revolution’ have climbed higher than 12,000 per month in some countries.

In Australia, Google Trends reports that over the past week, two of the five most searched for Bitcoin-related search terms are related to Bitcoin Revolution.

Most of the searches appear to be related to researching the scam, with phrases like ‘is bitcoin revolution legit’ and ‘bitcoin revolution review’ leading the pack.

A flood of fake celebrity endorsements

One tactic that Bitcoin Revolution uses is to promote its investment scheme through the use of fake celebrity endorsements which frequently appear on Facebook, Instagram, and other platforms.

A laundry list of celebrities have unwittingly had their name and image used to promote Bitcoin Revolution, including actors Kate Winslet and Hugh Jackman, TV personalities Simon Cowell and Jeremy Clarkson, and even political figures like Goh Chok Tong, the former prime minister of Singapore.

Facebook has come under fire for allowing the ads, which typically feature a well-known celebrity or public figure waxing enthusiastic about how much they have made through their investments on the platform.

Governments warn against Bitcoin Revolution

Just last week, the Malta Financial Services Authority (MFSA) issued a warning about a scam called Bitcoin Future.

In the warning, the agency noted that “this entity appears to present the same deceitful characteristics as another entity, Bitcoin Revolution.”

The MFSA had previously issued two separate warnings about Bitcoin Revolution in January and August of this year, cautioning its citizens that “information available to the MFSA suggests that Bitcoin Revolution is likely to be an international “get-rich-quick” cryptocurrency scam.”

“The public should, therefore, refrain from undertaking any business or transactions with the entity operating under the name of Bitcoin Revolution,” it added.

In the United Kingdom, the Financial Conduct Authority issued its own warning about similar scams last year.

While it did not specifically mention Bitcoin Revolution, the FCA did warn about a similar scam called Bitcoin Loophole.

A closer look at Bitcoin Revolution (Evolution)

To decide for myself whether or not Bitcoin Revolution was legit, I created dummy accounts at three separate websites running the same-named scam.

Scam A: the-bitcoinrevolution(dot)com – I found this one searching Google for ‘bitcoin revolution’.

Scam B: profittoday(dot)net/ck/bitrevolution/ – I found this stumbling across a fake ad in which actor Robert De Niro purportedly claims to be earning “tens of thousands of euros a day” from the investment scheme.

Scam C: securelywealth(dot)com/bitcoinevolution/ – This comes from the same fake ad in which actor Hugh Jackman supposedly announced his retirement from acting due to the massive amounts of money he was making.

Note: Since Micky originally reported on the Hugh Jackman story, the website has since changed its name from Bitcoin Revolution to Bitcoin Evolution.

All three websites make the same claims – in fact, I would estimate that 80% of the content is identical from one website to the next.

Using “proprietary” automatic trading software, the websites claim that users can expect to earn as much as $1,000 to $1,300 per day.

The software is so powerful, the scam states, that some users “earned their first million within just 61 days.”

Same scam, three different platforms

Using a fake name, email address, and phone number, I created accounts on all three websites.

The signup process was quick and simple – no proof of identification or other KYC steps needed.

Once logged in, the first thing I noticed was that each website had different software powering its trading platform.

Scam A was the only one that appeared to have its own platform. Scams B and C use third-party software from MonumentTrade and GeneralTrade, respectively.

Scam A also had a demo version of their platform, which was nice. I pretend-earned over US$200 in less than fifteen minutes.

Had I actually decided to deposit money into those accounts, Scams A and B would have required me to speak with a broker or account manager. Scam C uses a payment processor called VoguePay to enable deposits using a Visa, Mastercard, or existing VoguePay digital wallet.

All three websites boast that their trading software has won “numerous awards” including “first place in the Trading Software category for the US Trading Association,” which is odd considering that no resident of the United States can use the websites.

I tried to ask for help and got nothing

None of the websites listed any contact or business registration information and a WHOIS search on all three domains showed that each owner was hiding behind a proxy service.

The only reference at all to support or customer service was on Scam A’s website. In the FAQ section at the bottom of the page, it reads:

“At Bitcoin Revolution, we are always here for you and our professional and responsive customer service team can be contacted at any time.”

Unfortunately, the only means of contacting them is through a contact form that returns an error whenever an email is submitted.

Scam B’s contact page doesn’t even exist and an email sent via the contact form on Scam C’s website has yet to send the promised confirmation email and the ticket link they provided was broken as well.

So is Bitcoin Revolution legit or is it a scam?

I’m going to have to go with a resounding SCAM on this one. There are enough red flags surrounding Bitcoin Revolution to cover a football field.

Just to recap:

  • Fake celebrity endorsements
  • Impossibly outrageous profit claims
  • Multiple governments issuing warnings about it
  • Scheme operating under multiple domain names
  • Each copy of the scheme uses different trading platform software
  • No business registration information
  • No functioning means of contacting anyone

As Bitcoin scams go, Bitcoin Revolution / Evolution is particularly prolific and has been running in one form or another since at least 2017.

No sooner does one site get taken down than another one pops up.

Sadly, as interest in cryptocurrency continues to grow, so too will Bitcoin Revolution’s victim pool.

Don’t be one of them – do your due diligence before making any investment decisions.


By Cynthia Turcotte -November 5, 2019

David Ogden – Http://markethive.com/david-ogden

Can the Bitcoin BTC Price Surge 72 to Hit 16000?

Can the Bitcoin (BTC) Price Surge 72% to Hit $16,000?

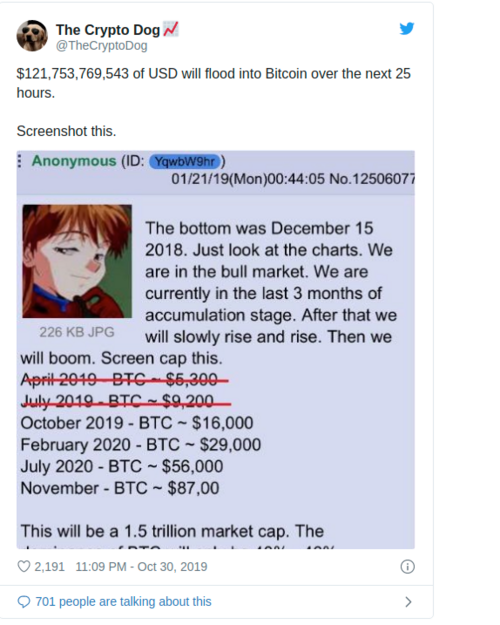
Last week, crypto investors were making much ado about a Bitcoin prediction that stated that the cryptocurrency would surmount $16,000 in October. As you likely know, this didn’t come true, with the cryptocurrency ending the month at around $9,300 — dozens of percent shy from the $16,000 predicted by the anonymous 4Chan predictor.

While this was a crushing blow to the Bitcoin optimists, there is still hope that the leading cryptocurrency will soon hit $16,000. That would represent a 72% rally from the current price of $9,200.

A $16,000 Bitcoin?

Changpeng “CZ” Zhao, the much-beloved chief executive of Binance, recently noted that Bitcoin may “see $16,000 soonish.” More specifically, he wrote that:

Lol, price predictions are easy. It’s just hard to be right about the timing. We will see $16k soon-ish. 1.4 billion people working on it as we speak.

The prominent cryptocurrency entrepreneur looked to the fact that China has just embraced blockchain technologies, which many analysts expect to have a positive trickle-down effect on decentralized cryptocurrencies and blockchains like Bitcoin and Ethereum. As one individual put it, blockchain is the gateway drug to BTC.

While CZ may be seen as too optimistic by cryptocurrency investors, there are some analyses that predict that BTC will soon begin to approach that range.

As reported by Ethereum World News, BitcoinGuru said that a massive head fake that Bitcoin just saw clearly satisfies a fractal — when historical price action plays out on current time frames at a different magnitude — that he has been tracking for a while now.

The fractal suggests that the recent drop and subsequent recovery is predicting a massive resurgence, one that will bring Bitcoin higher than its $14,000 year-to-date peak. He wrote that if Bitcoin closes around current levels, he expects for $16,000 to be reached by November 16th.

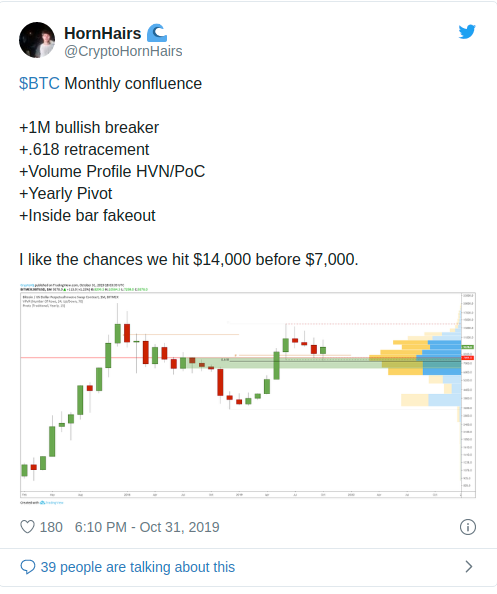
That’s far from the end of it. Trader HornHairs has noted that he “likes the chance we hit $14,000 before $7,000.” He remarked in a recent tweet that with BTC bouncing strong and holding above the one-month bullish breaker, the 0.618 Fibonacci Retracement of the entire cycle, the Point of Control as defined by the volume profile, and the yearly pivot, BTC is leaning rather bullish.

Nick Chong by Nick Chong November 4, 2019in Bitcoin News

David Ogden – Http://markethive.com/david-ogden
Bitcoin BTC Price Weekly Forecast: Signs of Bullish Continuation

Bitcoin (BTC) Price Weekly Forecast: Signs of Bullish Continuation

  • There are positive signs emerging for bitcoin above the $9,200 support against the US Dollar.

  • The price is slowly moving higher and it could retest the $9,770 resistance area in the near term.

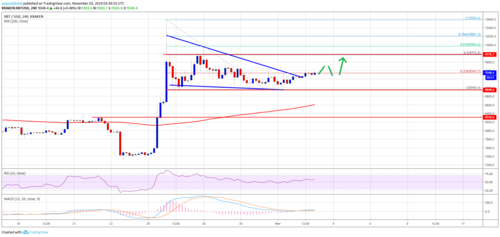
  • There was a break above a key contracting triangle with resistance near $9,240 on the 4-hours chart of the BTC/USD pair (data feed from Kraken).

  • The price remains well supported and it could even surge above $9,800 in the coming days.

Bitcoin price is trading above key supports near $9,000 and $9,200 against the US Dollar. BTC must stay above $8,600 to remain in uptrend and start a fresh increase.


Bitcoin Price Weekly Analysis (BTC)

This past week, there was a slow and steady decline in bitcoin below the $8,400 support against the US Dollar. Moreover, BTC price also traded below the $8,200 support area. Finally, it spiked below the $8,000 support, but remained well above the 100 simple moving average (4-hours).

A swing low was formed near $8,960 and the price recently started an upward move. There was a break above the $8,100 and $8,200 resistance levels to start a decent increase.

More importantly, there was a break above a key contracting triangle with resistance near $9,240 on the 4-hours chart of the BTC/USD pair. At the moment, the price is trading near the 23.6% Fib retracement level of the downward move from the $10,584 high to $8,960 low.

If there are more gains, the price could continue to rise towards the $9,500 and $9,600 resistance levels. Besides, the main resistance is near the $9,770 level. It represents the 50% Fib retracement level of the downward move from the $10,584 high to $8,960 low.

On the downside, there are many supports between $9,200 and $8,960. If there is a bearish break below the $8,960 swing low, there are chances of a sharp decline. The next key support is near $8,600 and the 100 simple moving average (4-hours).

Therefore, the $8,500 and $8,600 support levels are likely to play an important role. As long as the price is above the $8,500 support, there are chances of a fresh increase above the $9,500 level.

Bitcoin Price

Looking at the chart, bitcoin price is clearly showing signs of bullish continuation above $9,500. Having said that, a clear break above the $9,500 and $9,770 resistance levels is needed for uptrend acceleration. In the mentioned case, the price is likely to revisit $10,580.

Technical indicators

4 hours MACD – The MACD for BTC/USD is slowly gaining pace in the bullish zone.

4 hours RSI (Relative Strength Index) – The RSI for BTC/USD is now moving well above the 50 level.

Major Support Level – $8,960

Major Resistance Level – $9,500


Aayush Jindal

David Ogden – Http://markethive.com/david-ogden
Here Is Bitcoin’s Ideal Buying Price According to One Analyst

Here Is Bitcoin’s Ideal Buying Price (According to One Analyst)

On November 1, it was announced that the first regulated Bitcoin fund that has been available in North American exchanges will also be released in Canada.

3iQ Corp, a Canada based company received confirmation from the Ontario Securities Commission (OSC) in order to list ‘The Bitcoin Fund’ on Canada’s stock exchange. This is expected to be done by the end of 2019.

While the news has been positive, the Bitcoin price movement has been confusing, to say the least. The price has been gradually decreasing since October 25’s rapid upward move.

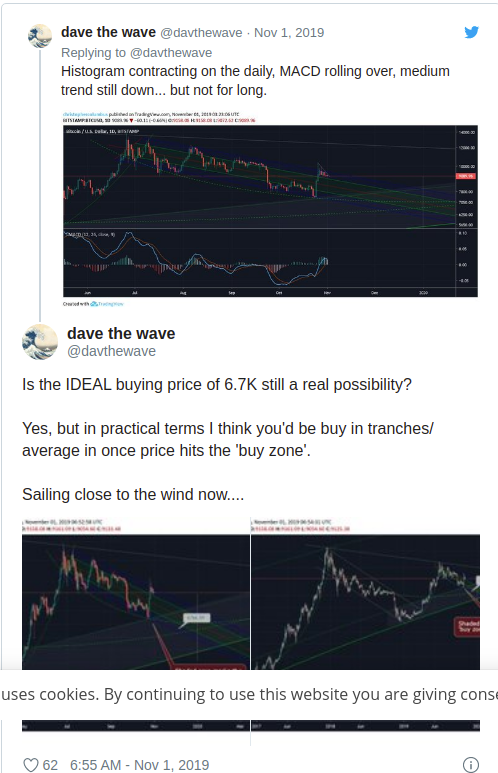
Cryptocurrency trader @davethewave speculated that the ideal buying price for Bitcoin is at $6700. According to our analysis, the ideal buying price may be in the low $7000s or high $6000s.

Additionally, he suggested that averaging in would be ideal — but what does that mean? Let’s analyze both the ideal price and the concept of averaging in.

Pitchfork & Volume

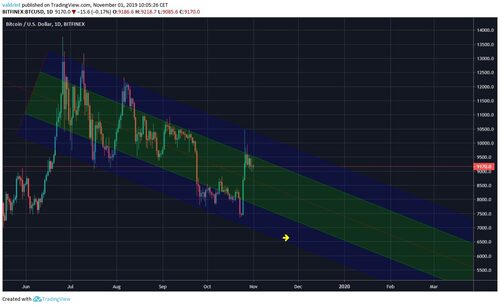
@davthewave used a pitchfork to create a descending channel and determine future price movement.

The ideal buy zone falls within the lower portion of the channel (blue). Since it is descending, the ideal buy price is decreasing as time goes by.


BTC Channel

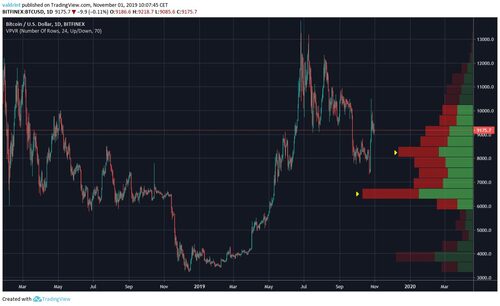
When using the Volume profile indicator, we can see that the strongest buy area is found near $6500 — coinciding well with the buy zone given by the channel.

A decrease below this level could trigger a rapid Bitcoin price decrease.

Long-Term Bitcoin Price Analysis

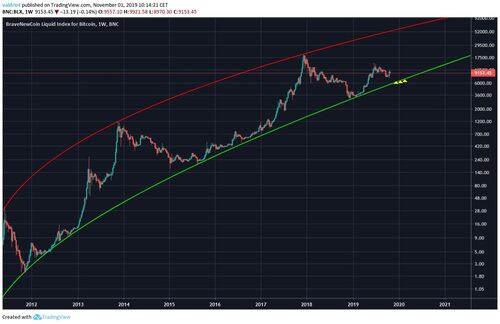
Using a logarithmic chart and curved trendlines, we can see that the support line is currently at $6300 and is slowly moving upward. Therefore, we agree that the ideal buying price may be around $6700.

The concept of averaging-in means placing several orders around an average price. One example of the $6700 price would mean buying with 1/3 of the total amount of your order at $6900, 1/3 at $6700 and 1/3 at $6500.


Valdrin Tahiri 1 min ago

David Ogden – Http://markethive.com/david-ogden