Bitcoin (BTC) Price Watch – Back to Support Yet Again!

Bitcoin (BTC) Price Watch -  Back to Support Yet Again!

Bitcoin (BTC) Price Watch – Back to Support Yet Again!

Bitcoin Price Key Highlights


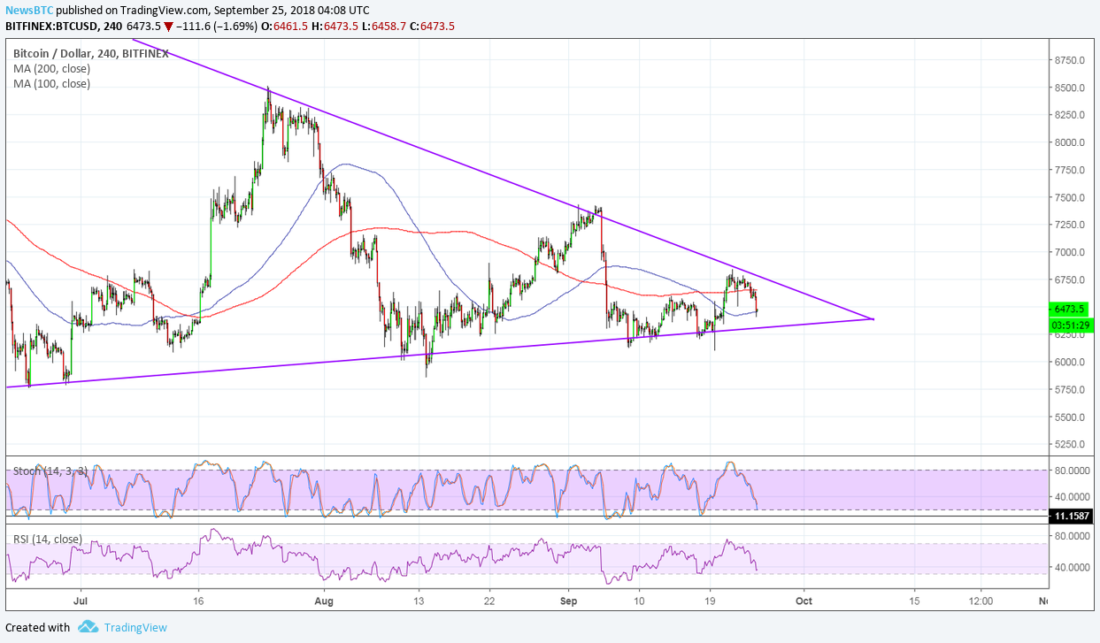
  • Bitcoin price has formed higher lows and lower highs to trade inside a triangle pattern on its 4-hour time frame.

  • Price got rejected on a test of resistance once more and a move to support appears to be taking place.

  • Technical indicators are suggesting that further declines could be in the cards.

Bitcoin price bounced off the top of its triangle consolidation pattern and is gearing up for another test of support.


Technical Indicators Signals


The 100 SMA is below the longer-term 200 SMA to signal that the path of least resistance is to the downside. In other words, support is more likely to break than to hold. Price is currently testing the 100 SMA dynamic inflection point and might be due for further losses if it breaks below this level or the $6,250 triangle bottom.

Stochastic is also heading south so bitcoin price might follow suit while sellers have the upper hand. This oscillator is nearing oversold levels, though, so bears might be feeling exhausted soon. RSI is pointing down and has more room to fall before hitting oversold levels, so sellers could stay in control for a bit longer.

The chart pattern spans $6,000 to around $8,250 so a break lower could be followed by a drop of the same height. Similarly an upside break could lead to a rally that’s the same height as the triangle.

Bitcoin price has drawn support from the SEC decision to open the comment period for the proposed rule change to list the bitcoin ETF by VanEck/SolidX on an exchange. This keeps traders’ hopes up that an approval may be in the works sooner or later as it managed to avoid a quick rejection.

Meanwhile, there appears to be no major catalyst that has spurred the sharp tumble, apart from profit-taking. Some point to the BIS report that regulation has been a driving factor for bitcoin price also.

SARAH JENN | SEPTEMBER 25, 2018 | 4:34 AM

David Ogden – Http://markethive.com/david-ogden

Bitcoin Price Analysis – BTC Acquires “Safe Haven” Status After Brexit Woes

Bitcoin Price Analysis -  BTC Acquires “Safe Haven” Status After Brexit Woes

Bitcoin Price Analysis – BTC Acquires “Safe Haven” Status After Brexit Woes

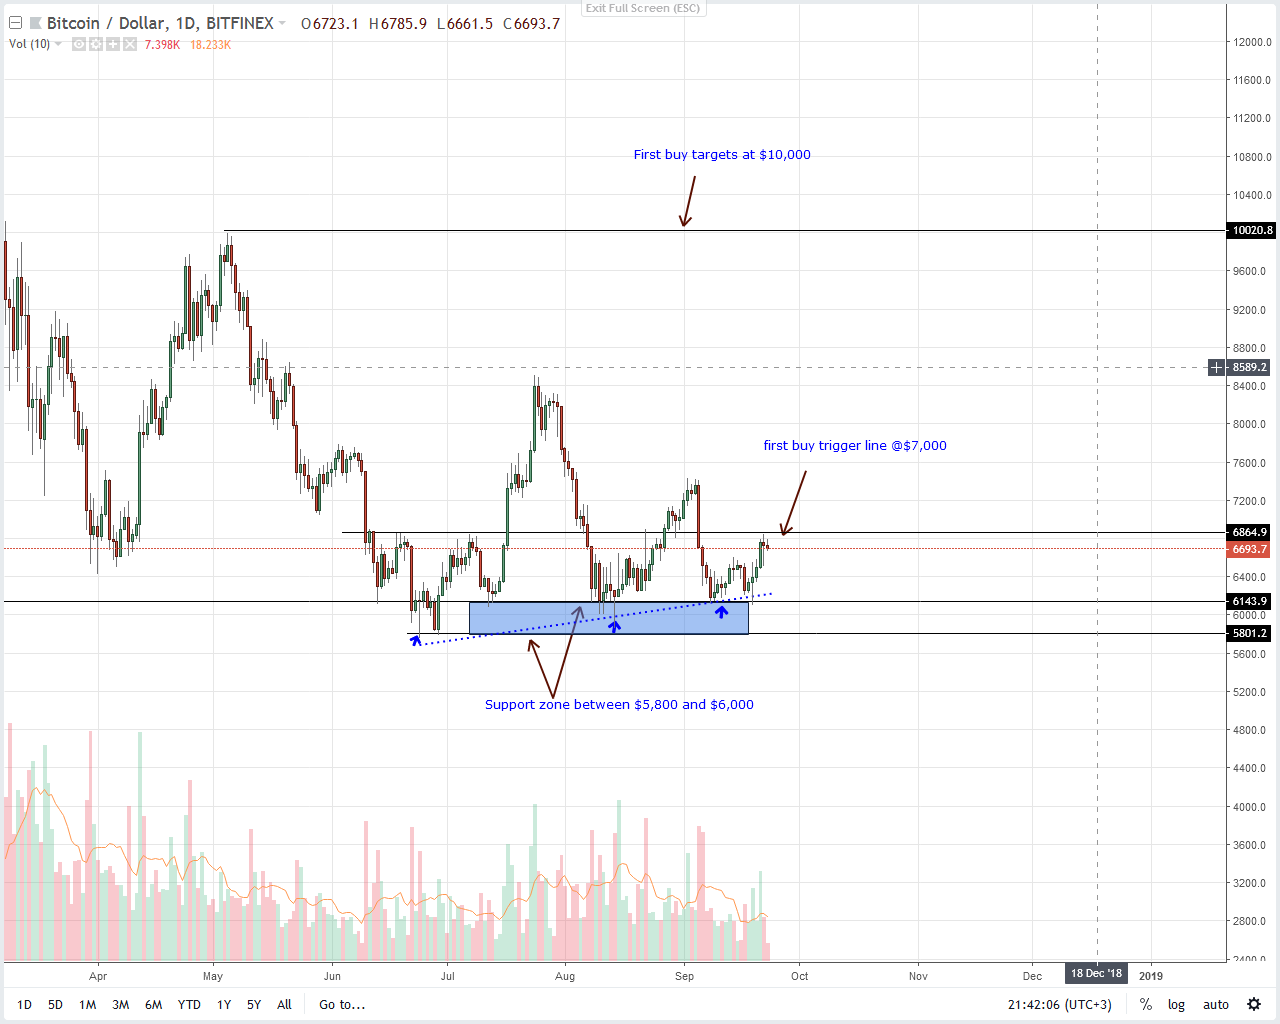
All in all, Bitcoin prices are on an uptrend. Backing these are boosting fundamentals with investors anchoring their bullish hopes on Bakkt, the ICE subsidiary. The platform will make use of Microsoft technologies for expediency. Regardless, our previous trade plan holds true. Even with a modest three percent gain in the last week, we need to see strong gains above $7,000 or safely $7,200 for trend continuation. Thereafter we shall recommend large volume buys with targets at $10,000.

Latest Bitcoin News

At current levels, Bitcoin prices are not only vibrant but are bottoming up. Bitcoin prices are up roughly $500 from last week’s lows. Factoring in candlestick formations, it appears that there is more room for upsides thanks to spikes in market participation levels.

All eyes are now set on Intercontinental Exchange (ICE), the owners of the New York Stock Exchange. The ICE plans on launching a new regulated “on-ramp” platform for institutional investors, merchants and retail investors to trade, store and spend various digital assets through

All aspects of the existing futures market will, for the first time, be part of physical delivery and warehousing of Bitcoin

Bakkt will utilize MS cloud solutions with backing from traditional Wall Street companies and crypto funds as Starbucks, BCG and Fortress Investments. Once they get the green-lights, Bitcoin prices will likely on a high by the end of the year as investors rush to invest. In fact the optimism is so high that Michael Novogratz, the Former Managing Partner at Goldman Sachs said it is impossible for Bitcoin prices not to test $10,000 by the end of the year re-affirming his previous stands on price.

Bitcoin Technical Analysis

Weekly Chart

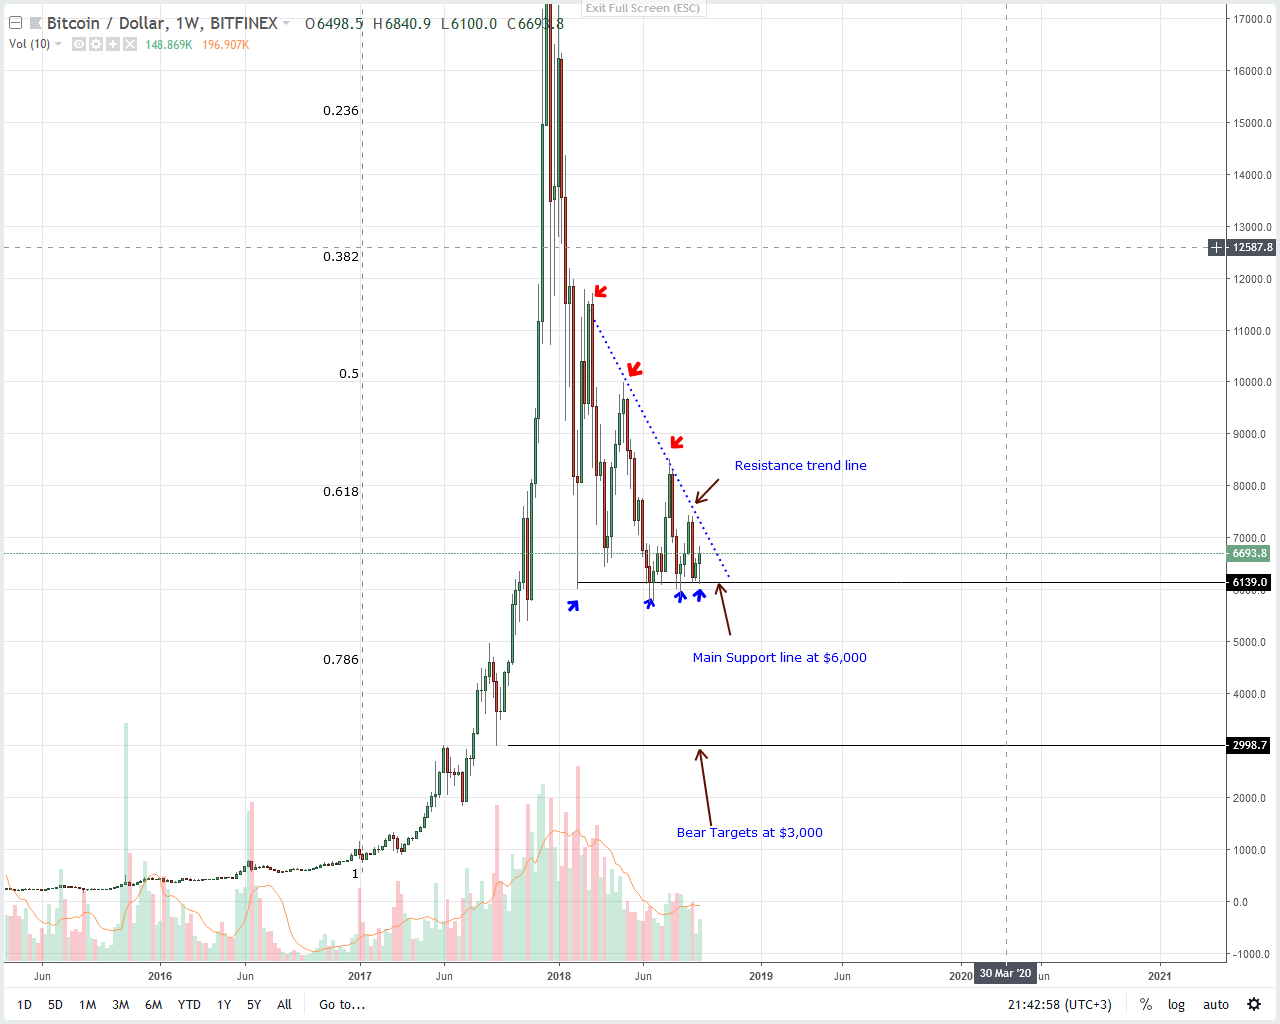
Though there is optimism in the market, our last Bitcoin trade plan is solid and on course. From the weekly chart, it’s clear that Bitcoin prices are on a consolidation. As they oscillate within a $1,200 range with supports at $5,800–$6,000 support and $6,800–$7,200 resistance level, our Bitcoin buy triggers would only go live once there are conclusive surges above the resistance trend line separating buyers and sellers at around $7,200—Sep 2018 highs. Besides the ranging market, the $6,000 level is proving to be a solid foundation for Bitcoin buyers.

After all, BTC sellers have so far retested $6,000, six times. Every time sellers fail to breach these resilient floors. Overly, this is good for BTC optimists. It goes to show how important $5,800–$6,000 level is from our analysis.

Daily Chart

Before Sep 18 surges, $6,500 or Sep 17 highs were our minor resistance level. Cementing our decision to anchor suitable stops and buy triggers at $6,500 was those high trading volumes of Sep 17.

Notice that average volumes before Sep 17 bearish engulfing candlesticks were low. Besides, we would strong reasons to hold on to short positions because Sep 18-20 candlestick volumes were low. However, after Sep 21 price explosion at the back of high volumes, sells were nullified and short term bulls were triggered with first targets at Sep 5 highs at $7,300.

In the course of this week, it’s likely that Bitcoin bulls will follow through. In that case conservative buyers would only enter long trades if and only if there is Sep 21-like breach above $7,000–$7,200. Thereafter, we can recommend loading on pull backs in lower time frames with first targets at $8,500 and later $10,000.


DALMAS NGETICH | SEPTEMBER 24, 2018 | 4:30 AM

David Ogden – Http://markethive.com/david-ogden

In Argentina, Investors Flock to Safe-Haven Bitcoin


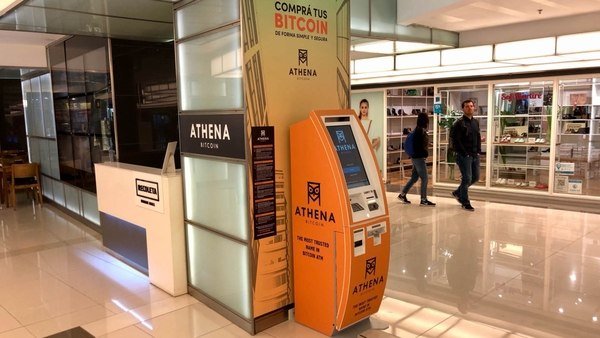
The economic crisis in Argentina is driving investors to buy Bitcoin in order to protect their wealth, pushing the cryptocurrency’s price higher in-turn. In parallel, to satisfy the increasing demand, the first of 12 Bitcoin ATMs has already begun to operate in a Buenos Aires mall. The number of stores accepting Bitcoin also continues to rise.

BITCOIN IS A SAFE-HAVEN DURING AN ECONOMIC CRISIS

As the country’s currency plunges, Argentinian investors and ordinary people are exchanging their pesos for Bitcoin (BTC) $6720.73 +0.22%. In this regard, economist and mathematician D.H. Taylor writes,

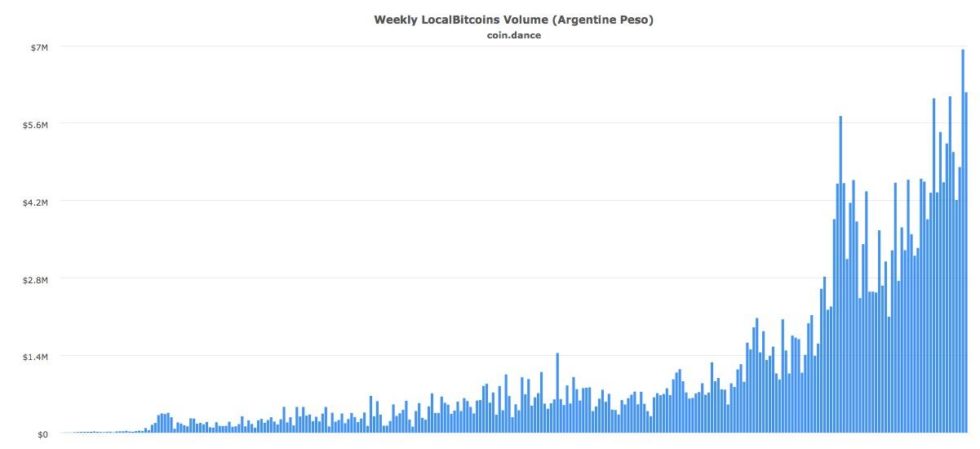
“Argentinians are moving in large numbers out of their peso and into a more stable currency, BTC. The numbers being witnessed by the markets in BTC are surging from Argentina.” And he adds, “The stability being offered by the digital currency is far greater than the peso and Argentinians are moving in quickly.”

As for substantiating evidence, Taylor refers to the chart below showing the weekly volume of Bitcoin purchases in Argentina:

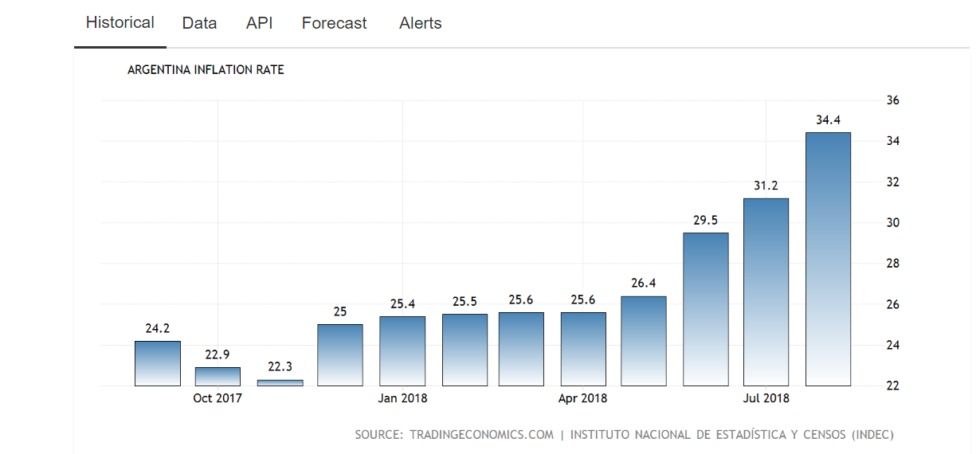
One of the wealthiest countries in Latin America, Argentina is once again undergoing a severe economic crisis. In April 2018, the peso started plunging against the dollar at an unexpected speed.
 

Most economists agree that the devaluation of the peso is due to investors’ doubts about the government’s ability to contain its unrelenting inflation and to minimize the effects of the U.S. Federal Reserve interest rate increases, which have strengthened the dollar all over the world.

Now, the Argentina year-over-year inflation rate reaches over 34 percent.

TAYLOR: THE BIGGEST SOLUTION IS BITCOIN

So far, the efforts of Argentina’s Central Bank to stabilize the peso have been to no avail. As a result, according to Taylor, the Central Bank is exploring the possibility of diversifying into Bitcoin,

The biggest solution is Bitcoin, or BTC-USD and, according to the data, Argentinians are buying large amounts. At the same time, the Argentinian Central Bank is considering diversifying their currency reserves into BTC.

The Central Bank has already eased regulations regarding ATMs in the country. This easing of regulations has facilitated the installation of ATMs processing cryptocurrencies.

In Argentina, Investors Flock to Safe-Haven Bitcoin

David Ogden – Http://markethive.com/david-ogden

Bitcoin Price Analysis: BTC/USD Testing Double Bottom Neckline

Bitcoin Price Analysis: BTC/USD Testing Double Bottom Neckline

Bitcoin Price Analysis: BTC/USD Testing Double Bottom Neckline

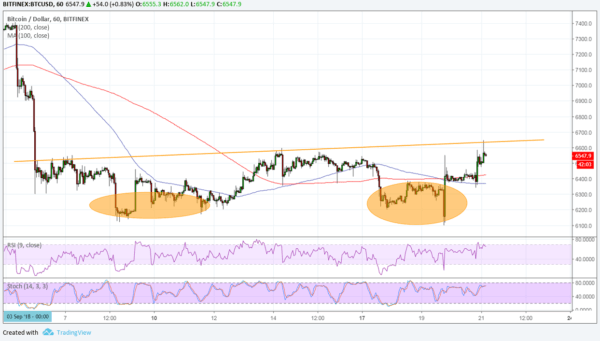
Bitcoin could be due for an uptrend anytime now as the price is already testing the neckline of its double bottom on the 1-hour chart. A break past the $6,650 area could lead to a climb that’s the same height as the chart formation, which spans $6,100 to $6,600.

However, the 100 SMA recently crossed below the longer-term 200 SMA to signal that bearish pressure is present. This could force the neckline resistance to hold and push Bitcoin back down to the bottoms again. Then again, the moving averages just seem to be oscillating to reflect consolidation conditions, so a bullish crossover might be possible again.

RSI is hovering close to the overbought zone to signal bullish exhaustion. Turning lower could confirm that sellers are taking over while buyers take a break. Stochastic has some room to climb before hitting overbought levels, though, so buyers could have a bit more energy left to push for a neckline breakout.

he SEC just issued an order to gather more input from the public to help in its ruling on the proposed rule changes to list the Bitcoin ETF from SolidX/VanEck. Recall that they already pushed the ruling deadline back on this and could still do so again, possibly not making any decision until February next year.

If so, Bitcoin bulls might still be disappointed but could continue to keep hopes up for an approval. A flat-out rejection, on the other hand, could douse any expectations that a strong rebound to the record highs could take place this year. Approval, although seemingly least likely, could usher in strong gains across the board.

The decision is due at the end of the month and analysts are already pointing to the buildup of short positions on Bitcoin, likely the cause for the sharp dip earlier this week.


SARA JENN · SEPTEMBER 21, 2018 · 1:00 AM

David Ogden – Http://markethive.com/david-ogden

Bitcoin (BTC) Price Analysis – Tossing And Turning At Wedge Support


Bitcoin (BTC) Price Analysis – Tossing And Turning At Wedge Support

Bitcoin has spiked around current support levels as bulls and bears battle it out.


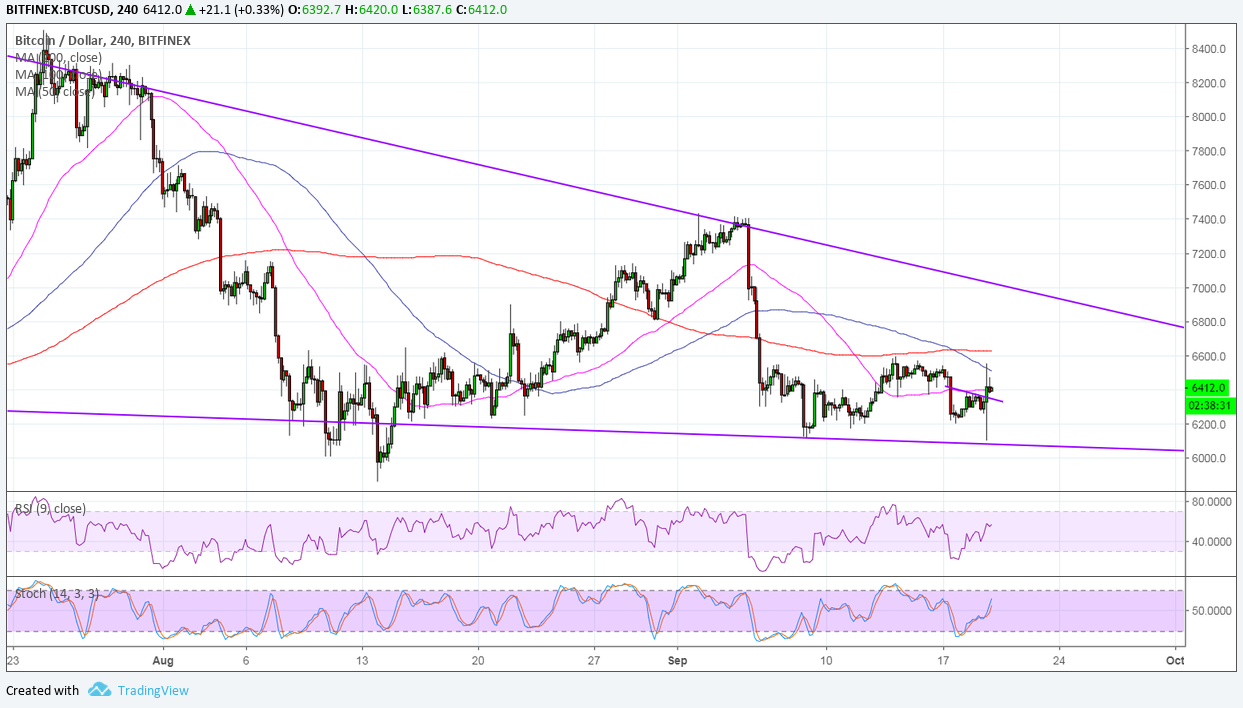
Bitcoin underwent a pickup in volatility, leading to spikes in both directions, but ultimately holding its head above the falling wedge support. Technical indicators are giving mixed signals, so it’s still tough to tell which direction the next move might go.


The 100 SMA just recently crossed below the longer-term 200 SMA to signal that the path of least resistance is to the downside. In other words, support is more likely to break than to hold. In that case, bitcoin could fall by the same height as the chart pattern. Price is also below the moving averages dynamic inflection points, which could keep holding as resistance.


RSI is on the move up, though, so there may be some buying pressure left in play. Heading further up until it reaches overbought levels could take bitcoin price along with it. Similarly stochastic has room to head higher before hitting overbought territory, so buyers could have some energy to push for more gains.


Price also looks ready to complete a double bottom formation on the latest bounce, with the neckline located around $6,600. A break past this resistance could spur a rally that’s the same height as the chart formation. Stronger bullish pressure could even lead to a test of the wedge resistance at $7,000 or a break higher, which might then be followed by a rally that’s the same height as the chart pattern.


Analysts point to the buildup of sell orders leading up to the SEC decision on bitcoin ETF applications. Recall that the regulator already rejected a handful then announced a decision to review those proposals. Soon after, the SEC decided to temporarily suspend a couple of crypto-based instruments, citing “confusion” on the nature of underlying markets and reiterating their mandate to protect consumers.


Still, bulls strongly defended support yet again as many have been waiting to buy on dips.

By Rachel Lee On Sep 20, 2018

Bitcoin (BTC) Price Analysis -  Tossing And Turning At Wedge Support

David Ogden – Http://markethive.com/david-ogden

Time to regulate bitcoin, says Treasury committee report

Time to regulate bitcoin, says Treasury committee report

Time to regulate bitcoin, says Treasury committee report


MPs in UK say ‘wild west’ cryptocurrency industry is leaving investors vulnerable


Bitcoin and other cryptocurrencies are “wild west” assets that expose investors to a litany of risks and are in urgent need of regulation, MPs on the Treasury select committee have said.


The committee said in a report that consumers were left unprotected from an unregulated industry that aided money laundering, while the government and regulators “bumble along” and fail to take action.


The Conservative MP Nicky Morgan, the chair of the committee, said the current situation was unsustainable.


“Bitcoin and other crypto-assets exist in the wild west industry of crypto-assets. This unregulated industry leaves investors facing numerous risks,” Morgan said. “Given the high price volatility, the hacking vulnerability of exchanges and the potential role in money laundering, the Treasury committee strongly believes that regulation should be introduced.”


Crypto-assets are not covered by the City regulator, the Financial Conduct Authority (FCA), and there are no formal mechanisms for consumer redress or investor compensation.


The committee argues in the report that at a minimum, regulation should be introduced to add consumer protection and counter money laundering.


It said that as things stood, the price of crypto-assets was so volatile that while potential gains were large, so too were potential losses. “Accordingly, investors should be prepared to lose all their money,” the committee said.


The FCA said: “The FCA agrees with the committee’s conclusion that bitcoin and similar crypto-assets are ill-suited to retail investors, and as we have warned in the past, investors in this type of crypto-asset should be prepared to lose all their money.”


A Treasury spokesman said: “We set up the joint Cryptoassets Taskforce earlier this year because we want to better understand the potential risks and benefits of crypto-assets to people, businesses, and the economy.”


In 2017, the price of a bitcoin soared by more than 900%, hitting a peak of almost $20,000 in December. Its popularity has since waned, with one bitcoin now priced at around $6,270.


Bitcoin: is it a bubble waiting to burst or a good investment?

Read more

The digital currency emerged after the financial crisis. It allows people to bypass banks and usual payment processes to pay for goods and services.


Last year Jamie Dimon, the chief executive of JP Morgan, said bitcoin was a fraud and only fit for use by drug dealers, murderers and people living in places such as North Korea. He said: “The currency isn’t going to work. You can’t have a business where people can invent a currency out of thin air and think that people who are buying it are really smart.”


Originally printed in the Guardian.

David Ogden – Http://markethive.com/david-ogden

Bitcoin (BTC) Price Watch – Bearish Wedge Breakout

Bitcoin (BTC) Price Watch - Bearish Wedge Breakout

Bitcoin (BTC) Price Watch – Bearish Wedge Breakout

Bitcoin Price Key Highlights
 

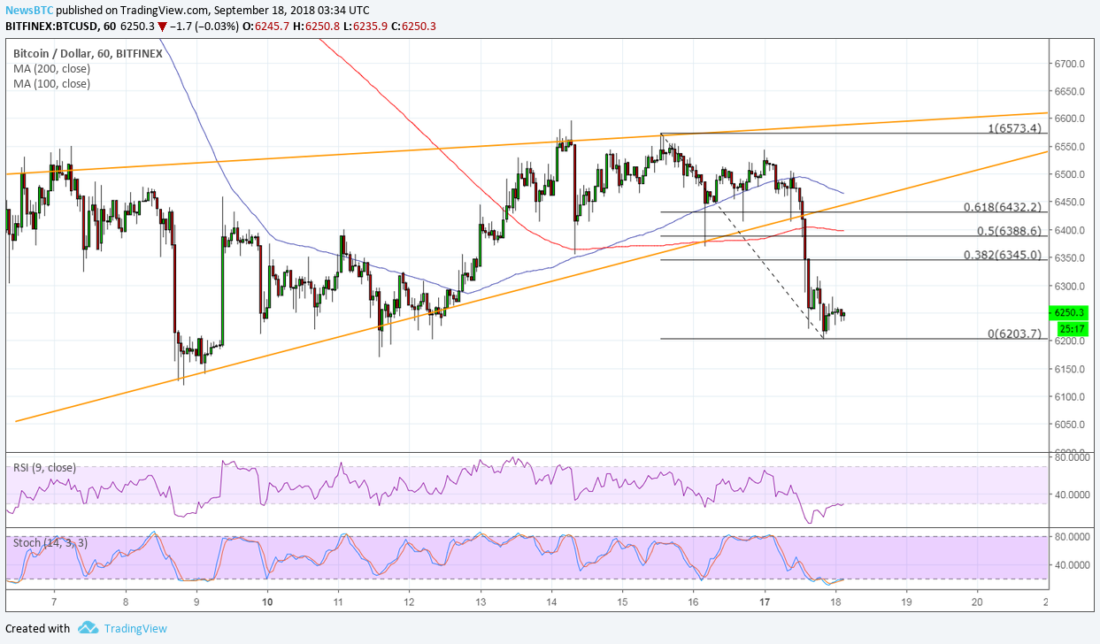
  • Bitcoin price recently broke below a rising wedge pattern to signal that further losses are in the cards.

  • Price might still pull back to the broken support area, which lines up with Fib levels, to gather more selling pressure.

  • Technical indicators are showing that there is still some bullish momentum left.

Bitcoin price made a downside break from its rising wedge pattern but might be due for a pullback before heading further down.
 

Technical Indicators Signals


The 100 SMA is above the longer-term 200 SMA to indicate that the path of least resistance is still to the upside. In other words, there still might be a chance for the uptrend to resume.
 

However, the gap between the two is narrowing to reflect weaker bullish momentum and a possible downward crossover. Bitcoin price has also tumbled below both moving averages, so these might hold as dynamic resistance moving forward.
 

RSI is turning higher after recently dipping into oversold territory, suggesting a possible return in bullish pressure. Stochastic also looks ready to climb out of the oversold region and bitcoin price could follow suit once it heads north.
 

However, price could hit roadblocks at the Fib levels marked on the breakdown. The 61.8% Fib lines up with the broken wedge support around $6,430 and the 50% Fib lines up with the 200 SMA dynamic inflection point. If any of these levels keep gains in check, bitcoin price could resume the slide to the swing low or lower.

Risk aversion has returned to broader financial markets on account of the fresh set of tariffs imposed by the US on China. These tariffs, which are due to take effect on September 24, levy 10% of duties on $200 billion worth of Chinese goods and the rate would increase to 25% by the end of the year.


With that, it’s understandable that traders are dumping their riskier holdings and flocking back to the safe-havens. Cryptocurrencies have been deep in the red once more, with declines led by ethereum.

SARAH JENN | SEPTEMBER 18, 2018 | 3:52 AM

David Ogden – Http://markethive.com/david-ogden

DOES THIS MARKET INDICATOR CONFIRM THE NOVOGRATZ PREDICTED REBOUND?

DOES THIS MARKET INDICATOR CONFIRM THE NOVOGRATZ PREDICTED REBOUND?

DOES THIS MARKET INDICATOR CONFIRM THE NOVOGRATZ PREDICTED REBOUND?

Bitcoin bull and highly cited cryptocurrency proponent Mike Novogratz called “bottom” this week on Twitter. On Friday, Bitcoin’s market performance and key market reversal indicated a possible turning point. What will Monday bring? Is the market still too bearish?


BITCOIN COULD HAVE OVERSOLD

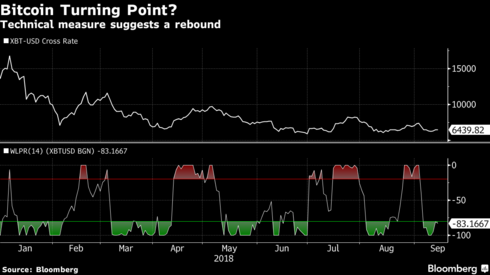
According to a Friday report from Bloomberg, a key market sign — the Williams %R Indicator — is showing the market for Bitcoin (BTC) $6517.38 -0.04% has “oversold.”
 

This may portend that the great Bitcoin selloff is finally over. The Williams %R Indicator moves between a level of 0 and -100, showing an overbought or oversold market.
 

According to Bloomberg’s chart below, that measure is sitting at -83. This equates to an oversold market. The last time this level was reached Bitcoin price subsequently rose 22%, says Bloomberg.

NOVOGRATZ FORECASTS BOTTOM AND REBOUND TO EQUAL 2017 BOOM

On September 13, 2018, Mike Novogratz referred to the Bloomberg Galaxy Crypto Index Chart, asserted a low, and likened market performance to “the point of acceleration that led to the massive rally/bubble.” He finished his tweet with the hashtag #callingabottom.
 

PRE-WEEKEND RALLY… WHAT WILL MONDAY BRING?

On the day of Novogratz’ tweet, Bitcoin’s value began at $6337.46 before rising to $6589.32. Over the weekend the price has fallen back, but not too far —$6495.18at the time of writing. Monday and next week’s trading will likely prove or disprove Novogratz and Bloomberg’s theories.

As per Bitcoinist’s analysis today, we could be looking at a slow and steady recovery towards $7000 or it could be an “oversold” bounce. We predict Bitcoin is “well situated” for short-term gains, but could still be victim to a bearish market.

Novogratz isn’t the only confident bull. Tim Draper, speaking at a DealStreetAsia summit in Singapore last week predicted the total market capitalization for cryptocurrencies will reach a whopping $80 trillion by 2023. As of today, Bitcoin is still dominating the cryptocurrency markets, with 55% of the total market capitalization invested in Bitcoin alone.

Bullish or Bearish? Where are your sentiments today? What do you think next week will bring?


MELANIE KRAMER | SEP 17, 2018 | 00:00

David Ogden – Http://markethive.com/david-ogden

4 Bitcoin Bull Markets: Big Lessons to Learn

4 Bitcoin Bull Markets: Big Lessons to Learn

4 Bitcoin Bull Markets: Big Lessons to Learn

Wall Street’s so-called “experts” are creatures of habit. They behave in patterns that are as predictable as the tides.

When a market soars into bubble-land, they pour out of the woodwork to cheer the “powerful fundamental forces” that are driving prices higher.

When the bubble inevitably bursts, they scramble to predict its demise.

And precisely when a brand-new bull market is in the making, they pronounce its last rites.

Rarely is this pattern as clear as in cryptocurrencies, a much-maligned asset to begin with.

Just today, I found two strident Bitcoin eulogies. One refers to the “mother of all bubbles.” The other says that there’s no future in crypto.

Neither mentions that both the market and the market analysts are subject to the same cyclical pattern that repeats itself regularly:

Bitcoin enjoys a massive bull market, culminating in a frenzied parabolic surge of speculation — the period we call “the climax.”

It comes crashing down as speculators beat a panicky retreat.

It consolidates for months, creating a dead zone of sideways action or further decline, from which only the diehard survive.

And it launches a new bull market, repeating the cycle — again culminating in a blast-off climax.

But here’s the key:

In Cryptocurrencies, Each New Cycle Peak Is Dramatically Higher Than the Previous One.

The story begins in September 2010, just eight years ago, when Bitcoin was trading at close to 6 cents. Today, this same asset is trading at around $7,000 per token, a return of over 11 million percent.

No, the path from a half-dozen cents to thousands of dollars isn’t easy. Nor is it a straight line. But that’s the whole point: It happens in a cyclical pattern and that cycle is ultimately predictable.


Bull cycle #1. September 2010 to June 2011.
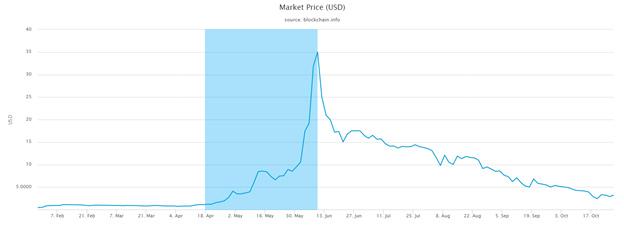
Bitcoin begins the cycle with a powerful but non-parabolic rise — from 6 cents to 80 cents by April 2011. Until this point, the rise is driven mostly by Bitcoin users and long-term investors who understand the technology and share the vision of its founder.

Then, suddenly, average investors begin to pile in. But the market is still minuscule, extremely illiquid and unable to accommodate crowds. So prices go ballistic: Bitcoin literally blasts off to the stratosphere, surging from 80 cents to a high of $36. (See blue-highlighted area of chart.)

The crash follows immediately thereafter, as Bitcoin plunges by 93%! Much like today, naysayers re-emerge — ranting about the “a failed experiment,” raving about “the death of Bitcoin.”

But it never trades below $2. So …

Even at the ultimate bottom of the crash, investors who bought at the beginning of the bull market cycle sit on gains of 38 times their original investment.


Bull cycle #2. October 2011 to April 2013.
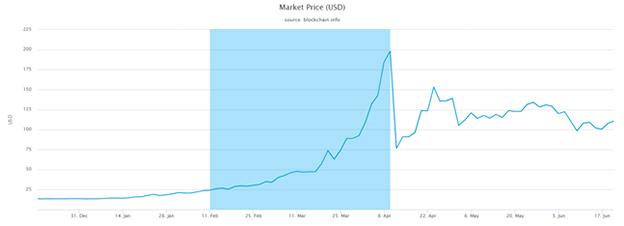
Like in the prior bull cycle, Bitcoin enjoys a very solid run from its $2 low to about the $10 level, up fivefold.

Long-term buy-and-hold investors (nicknamed the “HODLers”), who bought early in the prior cycle, are delighted. But anyone who joined the prior cycle during the frantic run-up to $35 is still frustrated.

The frenzy returns in early January. The king of cryptos breaks out above $13 and starts accelerating to the upside once again, exploding to a nosebleed bubble high of $260 in April 2013.

Total rise from bottom to peak: about 13,000%! But again, the overwhelming bulk of the move is jammed into just two short months, from February 2013 to April 2013.

The bust strikes with even-greater fury. In less than a week, Bitcoin is back down to $50 by April 15 — an instant 80% crash!

And as usual, the “Bitcoin-is-dead” crowd dominates the headlines.

But as in the prior bull run …

Even at rock bottom, anyone who bought near the beginning of this cycle is sitting on an asset worth five times their original investment.


Bull cycle #3. April 2013 to December 2013.
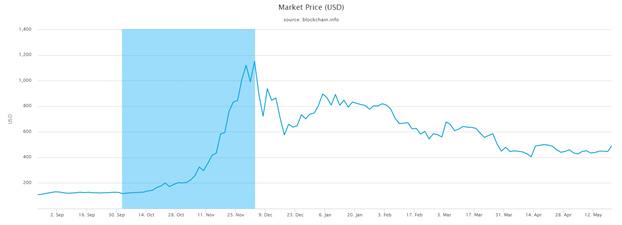
As before, the recovery from the April low of $50 is initially slow, reaching the $100 level by Oct. 1, 2013.

And as before, it’s the last two months that deliver the giant price explosion — to $1,160 by December, a surge of 1,160%.

Irrational exuberance infects not only average investors, but also the media, which sings the praises of crypto … until, that is, the next bust strikes, ushering in Bitcoin’s longest bull market to date:

From its $1,160 high made in December 2013, Bitcoin plunges to a low of $150 by January 2015, an 87% decline.

The bear market is so long and so deep, Bitcoin evangelist Andreas Antonopoulos says he’s worried about the future of crypto.

But as before …

Even at the bottom, investors who bought at the beginning of the cycle still have tripled their original investment.

Moreover, this point is also the beginning of the greatest Bitcoin bull market of all time …


Bull cycle #4. January 2015 to December 2017.
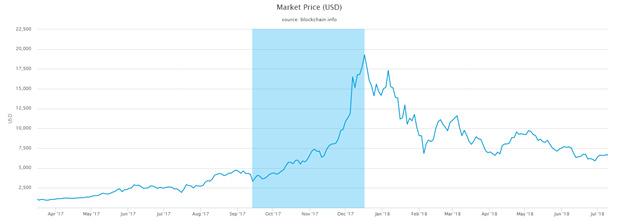
It takes Bitcoin a couple of years to recover from its great bear market of 2014.


Then, the big action begins in 2017, as Bitcoin launches a solid move from roughly $1,000 in January to about $5,000 in October.
 

As in the three previous cycles, however, it’s not until the last two months of the bull run that the public jumps in with both feet. Prices rise like a rocket. Bitcoin surges to its high of nearly $20,000 by December.

And of course, the crash inevitably followed — taking Bitcoin down to $5,800 on Feb. 6, 2018, a 70% decline.

Many analysts, not personally familiar with the prior bull cycles, argue as if this is somehow “a new phenomenon.”

But as you’ve clearly seen, it’s anything but
 

It’s déjà vu. And for the third time!

The Next Bull Cycle is Still in the Making

If history is any guide …

• The first few months of the next bull cycle could be slow and choppy. Don’t expect prices to explode suddenly. But this will be the ideal time to invest.

• The core of the bull market will be solid but not parabolic. A good time to add steadily to your holdings.

• It’s not until the final blow-off phase that you will see Bitcoin make new all-time highs and rise parabolically. Time to take most of your money off the table in phases.

• The next crash is bound to wipe out at least half of the gains. But as before, early investors will still come out ahead. Even those who just HODL should be sitting on some fat profits.


3 Major Changes in the Bitcoin Bull Cycles

Some analysts may think the ups and downs in Bitcoin are just an endless merry-go-round. But the fact is, with each bull cycle, the cryptocurrency markets are also evolving and making progress toward a more mature phase, ushering in three major changes.
 

Change #1. Bitcoin is no longer alone.

With each cycle, especially the most recent one, a wide variety of new cryptocurrencies have been introduced — several with far more advanced technology and use-cases. We’ve seen the introduction of Ethereum and smart contracts … the emergence of Ripple, Stellar, NEO, EOS and Cardano … and soon, Hedera Hashgraph.
 

Change #2. Trading volume and liquidity have improved.

Consequently, the climactic phase (the last two months) of the bull cycle is becoming relatively less extreme.

• In the climax of the first bull cycle (ending June 2011), Bitcoin shot up 4,500%.

• In the climax of second bull market cycle (ending April 2013), the rise was 1,300%.

• In the climax of the third cycle (ending December 2013), prices increased 1,160%.

• And in the climax of the fourth cycle (through December 2017), Bitcoin surged by 400%.
 

Change #3. Adoption and infrastructure have steadily grown.

Before 2010, all trading was over the counter. In 2013, only one exchange existed. And in 2014, the biggest exchange, Mt. Gox, failed. But the consequence was the birth of dozens of new, more secure exchanges. And today, there are 206 operating exchanges, according to CoinMarketCap.com.

Stepping back from the trees, it’s clear that the best days of cryptocurrencies are yet to come.

From a fundamental standpoint, engagement in cryptocurrencies has never been greater. The infrastructure and underlying technology are in the best state that they’ve ever been. In the long term, there’s only one way to go from here: onward and upward.
 

By Juan M. Villaverde

September 16, 2018

Juan Villaverde is an econometrician and mathematician devoted to the analysis of cryptocurrencies since 2012. He leads the Weiss Ratings team of analysts and computer programmers who created Weiss cryptocurrency ratings.


David Ogden – Http://markethive.com/david-ogden

Bitcoin will reach $8500 by end of year, says Trefis; predicts ETF approval will cause bull run

Bitcoin will reach $8500 by end of year, says Trefis; predicts ETF approval will cause bull run

Bitcoin will reach $8500 by end of year, says Trefis; predicts ETF approval will cause bull run

Trefis Team, a firm offering software that predicts market movements, recently offered their opinion on the price of Bitcoin [BTC]. While the cryptocurrency market has been seeing bullish news lately, the price continues to exhibit sluggish movement.

Bitcoin, the top cryptocurrency, is currently trading at the $6500 mark after a series of sharp drops last week. Goldman Sachs stated that they would delay the plans of its cryptocurrency trading desk, leading to a widespread selloff due to FUD.

However, Trefis claims to have predicted the price of Bitcoin by the end of 2018, putting it around $8500 around the timeframe. Their predictions are based on the overall transaction volume for Bitcoin and the total number of users on the blockchain. Moreover, their predictions, when backtested, are reportedly 94% accurate as stated on their website.

They utilize the principles of supply and demand to fundamentally determine the price of Bitcoin. The cryptocurrency, with its capped supply and deflationary system of bringing new coins into existence, has a supply system that would help the case of its price rising. The two variables that Trefis has considered to calculate the demand is the number of active users and the amount they transact.

According to these calculations, they expect the price of Bitcoin to undergo a 30% increase over the year, quoting reasons such as the general sentiment dictated by the news. This, according to them, was the reason for the price to go up to $20,000 late last year. They also stated that the price has moved in tandem with news, with dips being observed when exchanges were hacked and when the United States Securities and Exchanges Commission [SEC] denied applications for an exchange-traded fund [ETF].

According to Trefis, the creation and general lobbying of the Blockchain Association will also create a more positive view for regulators. They stated that the approval of the ETF by the SEC is one of the biggest catalysts for the growth of Bitcoin. It represents a “huge potential upside” to the price of Bitcoin.

Iarius Germund, a market analyst, stated:

“While the market still responds sluggishly to a lot of the news coming out right now, the base is gradually being built. At the same time last year, the cryptocurrency market did not have many of the things it required for mainstream adoption as an asset class. We have made considerable progress on that end, but the price is only likely to move when actual changes occur in the market with respect to adoption.”


Anirudh VK

Published 29 mins ago on September 15, 2018

David Ogden – Http://markethive.com/david-ogden