Bitcoin Surges 5% in Minutes – Can it Lead to Bigger Rallies This Month?


Bitcoin Surges 5% in Minutes – Can it Lead to Bigger Rallies This Month?

The Bitcoin price has surged by six percent on the day to $4,070, breaking out of the $4,000 mark comfortably for the first time since Christmas Eve.

Bitcoin’s strength does not convince many traders of a big short-term bull rally.

Could Bitcoin Engage in Bigger Rallies in January?

With a 20 percent increase in its daily trading volume, Bitcoin has been able to show some momentum above $4,000. But, as DonAlt, a cryptocurrency technical analyst said, the slight increase in the price of Bitcoin is not sufficient to declare a trend reversal even in the short-term.

The analyst said:

Finally an impulse. If today closes above resistance (4000) I’ll be looking for buy opportunities/close my hedge short. If it closes below resistance I’ll be looking for shorts. Dangerous to trade in any direction with the Finex maintenance coming up tomorrow.

Both BitFinex and BitMEX, two of the largest margin trading platforms for Bitcoin, are set to run maintenance on January 7, suspending trades.

If Bitcoin closes the day at $4,000 and shows some positivity in the short-term, it may allow the asset to prepare for upward price movements in tight ranges.

But, generally, traders saw the price movement of Bitcoin as a lackluster move following poor several days subsequent to Christmas Eve

“Another day, another lacklustre move. Is this the top? I’m looking for $180B if we can turn $140B into support, otherwise not much too get excited about just yet,” a cryptocurrency trader with the online alias “The Crypto Dog” wrote.

Bitcoin could engage in bigger rallies throughout January, potentially eyeing a breakout above $4,500. Still, without a breakout above $6,000 and resistance levels above it, it is challenging to justify a bottom.

One trader said that Bitcoin is likely to see a boring first two quarters in 2019. With volatility in a low price range, it will be unable to recover to key levels.

“The good news is that the low is likely in. The bad news is that we go sideways here for another 6+ months before moon mission starts again for new ATH’s. The good news about the bad news is that with BTC going sideways for 6+ months (If this Forecast Map is in anyway accurate) then we’re having a nice long [alternative digital asset] season,” one trader said.

Volume is Key

The short-term trend of Bitcoin is uncertain due to the scheduled maintenance of two major exchanges.

A key element in the dominant cryptocurrency’s performance over the next few weeks will be its daily volume. Throughout the past two weeks, Bitcoin has maintained a volume of over $4 billion. This is lower than its average volume at around $4.5 billion.

Currently, volume hovers at nearly $6 billion. If it can sustain such a high volume, BTC will be able to sustain its momentum.
 

AUTHOR

Joseph Young

Hong Kong-Based Finance and Cryptocurrency Analyst / Writer. Contributing regularly to CCN and Hacked. Offering cryptocurrency news and Insights Into Asian Market (South Korea, Japan, and more

David Ogden – Http://markethive.com/david-ogden

Bitcoin Price Weekly Analysis – BTC Approaching Significant Break

Bitcoin Price Weekly Analysis - BTC Approaching Significant Break

Bitcoin Price Weekly Analysis – BTC Approaching Significant Break

Key Points

Bitcoin price failed to gain momentum above $3,900 and declined recently against the US Dollar.

  • There is a major contracting triangle formed with support at $3,765 on the 4-hours chart of the BTC/USD pair (data feed from Kraken).

  • The pair is approaching the next significant break either above $3,850 or below $3,750.

Bitcoin price is trading near important support levels against the US Dollar. BTC/USD may soon make the next move either above $4,000 or below $3,500.

Bitcoin Price Analysis

This past week, bitcoin price moved higher above the $3,800 resistance against the US Dollar. However, the BTC/USD pair struggled a lot to clear the $3,900 resistance level. To start with, a swing low was formed near $3,720 and later the price started an upward move. It broke the $3,800 resistance and the 100 simple moving average (4-hours). The price even traded above the 50% Fib retracement level of the last decline from the $3,920 high to $3,722 low.

However, the price faced a strong resistance near the $3,850 and $3,870 levels. Besides, the 76.4% Fib retracement level of the last decline from the $3,920 high to $3,722 low also prevented gains. Buyers failed to push the price above $3,900 and later the price declined. It traded below $3,800 and the 100 SMA. Having said that, the price is now approaching the key support area near $3,765. More importantly, there is a major contracting triangle formed with support at $3,765 on the 4-hours chart of the BTC/USD pair.

Looking at the chart, BTC price seems to approaching the next significant break either above $3,850 or below $3,765. An upside break above $3,850 may push the price towards $4,000 and $4,200. On the other hand, a break below $3,765 could spark bearish moves towards $3,500 or $3,300.

Looking at the technical indicators:

4-hours MACD – The MACD for BTC/USD is placed in the bearish zone.

4-hours RSI (Relative Strength Index) – The RSI is currently well below the 50 level.

Major Support Level – $3,765

Major Resistance Level – $3,850


AAYUSH JINDAL | JANUARY 6, 2019 | 5:00 AM

David Ogden – Http://markethive.com/david-ogden

Bitcoin (BTC) Long Term Price Forecast- January 5

Bitcoin (BTC) Long Term Price Forecast- January 5

Bitcoin (BTC) Long Term Price Forecast- January 5

BTC/USD Long-term Trend: Bearish

Resistance levels: $7,200, $7,300, $7,400

Support levels: $3,800, $3,700, $3,600

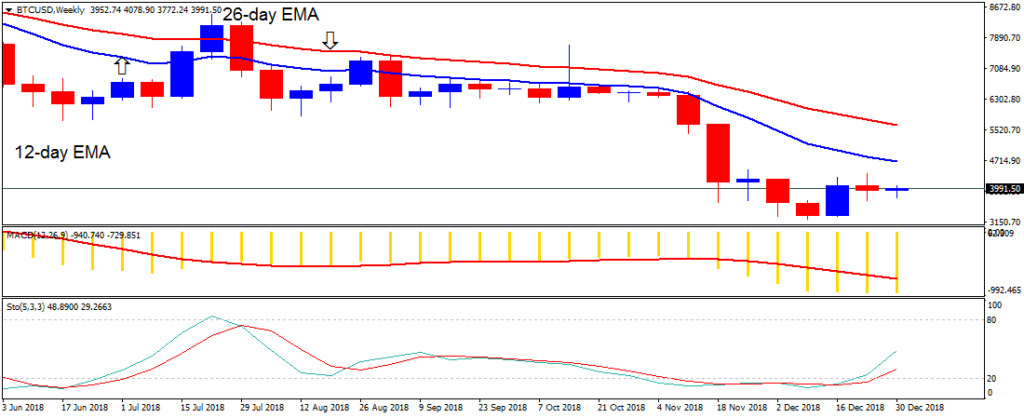
The BTCUSD pair had been ranging in the last ten days. In the short time frame, Bitcoin was ranging at the $3,900 price level. The crypto’s price also faces resistance at the $4,000 price level. However, the BTC price has an opening balance of $3,862.60 in the month of January . From the weekly chart, the price of Bitcoin is in the bearish trend zone.

In other words, the crypto’s price is below the 12-day EMA and the 26-day EMA which indicates that Bitcoin is likely to fall. Meanwhile, the MACD line and the signal line are below the zero line which indicates a sell signal.

In addition, the stochastic is in the oversold region but above the 20% range. This indicates that the price of Bitcoin is in a bullish momentum and a buy signal. In the meantime, the blue band of the stochastic is above the red band indicating the reversal of the previous trend.

By Azeez M – January 5, 2019

David Ogden – Http://markethive.com/david-ogden
Thriving on bitcoin’s bust

Thriving on bitcoin's bust

Thriving on bitcoin’s bust

As a growing number of cryptocurrency ventures struggle for funding, cut staff or shut down, all is well in one small corner of the industry: lending.

Creditors focusing on the crypto arena say they’re finding strong demand from borrowers who don’t want to sell their virtual coins at depressed prices, as well as from big investors eager to borrow coins for short selling. It’s putting lenders on both sides of bitcoin’s bust – helping believers pay their bills while awaiting a rebound, and also enabling bets by people who think the drop has further to go.

New York-based BlockFi says its revenues and customer base have grown 10-fold since June, when Michael Novogratz’s Galaxy Digital Ventures invested $52.5 million. Aave, which owns online crypto-lending marketplace ETHLend, just opened an office in London, plans to enter the US soon, and is nearing profitability. And Salt Lending, which already employs 80 people, said it’s hiring more every month as its revenue ticks higher.

Most lenders in the crypto industry set up shop in 2017, initially offering enthusiasts a way to borrow cash without having to sell down their stockpiles of bitcoin or other crypto assets they believed would soar even higher. But when prices crashed in 2018, lenders pivoted into new roles and continued to flourish. The lending niche, it seems, may fare even better in bad times than good.

Bear market fuelling growth

“The bear market has certainly helped – at least has fuelled the growth,” says Genesis Capital CEO Michael Moro.

Genesis, which launched in March to let institutional investors borrow virtual coins by depositing US dollars, has already issued $700 million of loans. It now has about $140 million in loans outstanding with an average duration of six weeks, according to Moro. Genesis plans to more than double its staff in the coming year to as many as 12 people, and is looking at growing in regions such as Asia.

“We’ve been profitable from day one,” says Moro. “We’ve certainly proven that there is market demand, that there’s product fit and that it’s time to invest even more in this side of the business.”

The company typically requires customers to deposit around $1.2 million in fiat to take out $1 million of crypto. It charges an annual rate of between 10% and 12% to borrow bitcoin, for example.

Companies that accept cryptocurrencies as collateral for cash loans usually demand much larger buffers to ensure they don’t get burned by falling prices. BlockFi typically requires customers deposit $10 000 of digital coins to take out $5 000 in fiat, according to CEO Zac Prince.

Low-risk lending

When collateral drops in value, customers face margin calls, often starting with a warning that their holdings may be sold off soon. At BlockFi, margin calls are triggered if the price of the crypto collateral falls by 35 to 60% from the time the loan was granted. Price says about 20% of the start-ups’ loans faced margin calls last year. Many more borrowers added collateral when warned.

“We’ve never had a loss of principal,” he says. “It’s a low-risk type of lending, assuming you are able to manage that liquidity and track the volatility.” The company’s interest rates start at 7.9%.

Lenders aren’t entirely immune to the turmoil so common in the crypto world. The Securities and Exchange Commission has been scrutinising Salt’s initial coin offering – a fundraising in which start-ups sell virtual coins to investors – and whether the sale amounted to an unregistered securities offering, the Wall Street Journal reported in November, citing unidentified people familiar with the matter. The company declined to comment.

Magic’ in bust

“From a consumer perspective, we will start to look like a diversified fintech company – that started with loans,” says Prince. “Similar to a company like SoFi, who started as just a student lender and expanded to mortgages, wealth management, and now deposit accounts.”

BlockFi is, in fact, planning to offer more credit products, including a bitcoin interest-bearing savings account and a loyalty card earning crypto. ETHLend is working to provide its technology to other lenders in Switzerland and Australia, so they can also accept crypto collateral.

“Everything flies in the bull market, but true magic happens when it does well in a bear market,” Aave CEO Stani Kulechov said in a phone interview. “The crypto-backed lending model is one of the rarest.”


© 2019 Bloomberg L.P

David Ogden – Http://markethive.com/david-ogden

Bitcoin Price Watch – BTC Primed To Break $4K

Bitcoin Price Watch -  BTC Primed To Break $4K

Bitcoin Price Watch – BTC Primed To Break $4K

Key Points

  • Bitcoin price is grinding higher and it recently broke the $3,900 resistance against the US Dollar.

  • There is a key ascending channel formed with support at $3,850 on the hourly chart of the BTC/USD pair (data feed from Kraken).

  • The price may decline a few points before it makes an attempt to clear the $4,000 resistance.

Bitcoin price is showing positive signs above $3,800 against the US Dollar. BTC remains well supported on the downside for more gains above $4,000.

Bitcoin Price Analysis

Yesterday, we discussed that bitcoin price remains buy on dips near the $3,700 level against the US Dollar. The BTC/USD pair remained in a nice uptrend and it moved above the $3,820 and $3,900 resistance levels. The price traded as high as $3,923 and it is currently correcting lower. It broke the $3,900 support, but it is placed well above the 100 hourly simple moving average.

At the outset, the price is testing the 23.6% Fib retracement level of the recent wave from the $3,646 low to $3,923 high. More importantly, there is a key ascending channel formed with support at $3,850 on the hourly chart of the BTC/USD pair. Should there be a downside break below the channel support, the price may test the $3,780 support. It represents the 50% Fib retracement level of the recent wave from the $3,646 low to $3,923 high. Therefore, if the price corrects lower in the short term, buyers may appear near $3,850 or $3,780. On the upside, a break above the $3,900 and $3,930 levels may push the price towards $4,000.

Looking at the chart, bitcoin price is trading nicely above the $3,780 support. If there are more declines, the next key support is near the $3,750 and the 100 hourly SMA.

Looking at the technical indicators:

Hourly MACD – The MACD for BTC/USD is slowly moving in the bearish zone.

Hourly RSI (Relative Strength Index) – The RSI is placed nicely above the 50 level.

Major Support Level – $3,780

Major Resistance Level – $3,930


AAYUSH JINDAL | JANUARY 3, 2019 | 5:00 AM

David Ogden – Http://markethive.com/david-ogden

Fred Wilson’s 2019 outlook – Crypto will enter new bullish wave after seeing bottom

Fred Wilson's 2019 outlook - Crypto will enter new bullish wave after seeing bottom

Fred Wilson's 2019 outlook – Crypto will enter new bullish wave after seeing bottom

Venture capital investor, Fred Wilson starts the new year by posting his prediction on what’s going to happen in 2019 on his website.

His prediction covers many aspects from politics, global economy, stock market, tech business, including cryptocurrency, quoting what he said, “Any set of predictions for 2019 from me on this blog would not be complete without some thoughts on crypto.”

He started by predicting the fall of President Trump due to the reaction of the House towards the report of Robert Muller about his illegal activities.

The “Washington drama” somehow will impact the US economy severely, starting with the capital markets to interest rates, which results in a weaker economy.

That said, the man behind various Web 2.0 investment, such as Twitter, Tumblr, Foursquare, Kickstarter and MongoDB is convinced that the crisis will not be experienced by the startup/tech economy.

Wilson believes the macro trend will not impact the startup/tech economy as it’s driven first and foremost by technical and creative innovation.

As for the crypto industry, he said, “I think we are in the process of finding the bottom on the large, liquid, and lasting crypto-tokens. But I think that process could take much of 2019 to play out.”

Furthermore, he added, “I expect we will see some bullish runs, followed by selling pressures taking us back to retest the lows. I think this bottoming out process will end sometime in 2019 and we will slowly enter a new bullish phase in crypto.”

Wilson thinks the next bullish phase is triggered by the fulfilment of promises of some projects from 2017, such as Filecoin and the Algorand project.

He also mentioned his expectation to see a number of “next gen” smart contract platforms that will challenge Ethereum, followed by Ethereum’s defending its leadership through a number of important system improvements.

Aside from that, the Union Square Ventures co-founder expects to see a wider adoption of cryptocurrency, particularly in developing countries through stablecoins, NFT/cryptoassets/cryptogaming, and earn/spending opportunities.

Having such bullish predictions towards crypto industry, Wilson stated that he still has some concerns about it, particularly related to the actions of “misguided regulators” that will “harm” high quality projects.

Moreover, the dark side of crypto, such as scams, failed projects, and losing investments will still exist in 2019, which he said, they could be “a drag on the sector.”

However, he also mentioned that it’s always the case with new emerging technology that allows anyone to set up shop and get going.

“Permissionless innovation produces the greatest gains over time but also comes with the inevitable bad actors and actions,” he said.

“Do I sound pessimistic? I suspect I do, but I am not. I am incredibly optimistic… It is going to be a doozy,” he closed his 2019 prediction.


02 JAN, 2019 | UPDATED: 02 JAN, 2019 BY FIFI ARISANDI

David Ogden – Http://markethive.com/david-ogden

Bitcoin [BTC] Technical Analysis – Bull carries coin to green pastures

Bitcoin [BTC] Technical Analysis - Bull carries coin to green pastures

Bitcoin [BTC] Technical Analysis – Bull carries coin to green pastures

As the year comes to an end, Bitcoin [BTC] marks the end with a little slip. BTC, at the time of press, had slipped by 2.38% over the past 24 hours.

The coin was valued at $3,792.32 with a market cap of $66 billion. The coin registered a 24-hour trade volume of $4.7 billion with a fall of over 9% over the past seven days. The coin is still falling with a slip of 1.10% over the last hour.

1-hour

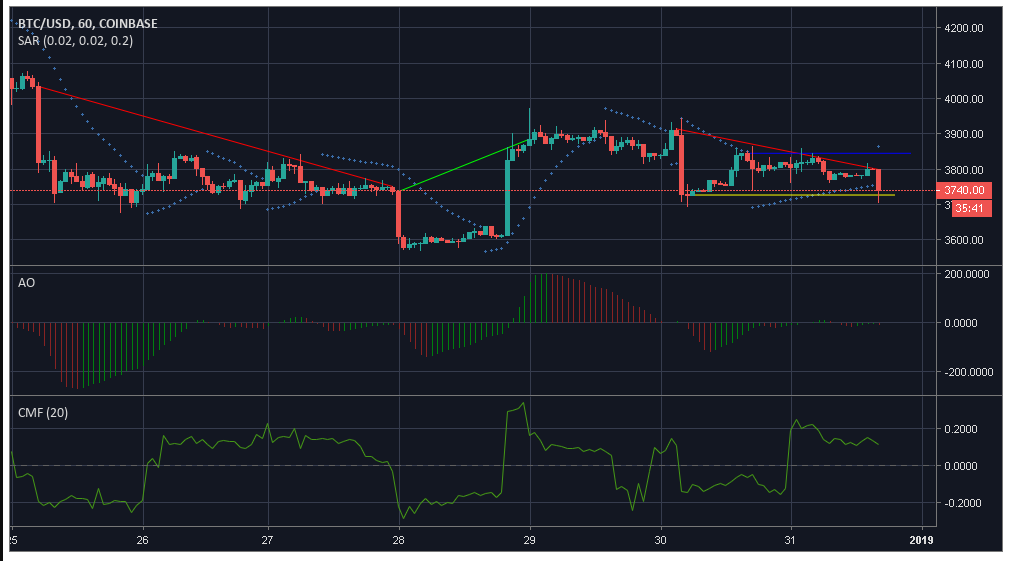
As per the one-hour chart of BTC, the coin observed a downtrend from $4034 to $3748.09, after which the coin shot up to $3736.51 to $3884.71. The coin then fell from $3914.04 to $3799.26. The coin is offered support at $3727, with immediate resistance at $3845.

Parabolic SAR hints towards a bearish as the markers align above the candlesticks.

Awesome Oscillator indicates a bearish momentum emerging, but as per the previous trend, it might be a short-lived one.

Chaikin Money Flow points above zero, marking a bullish market.

1-day

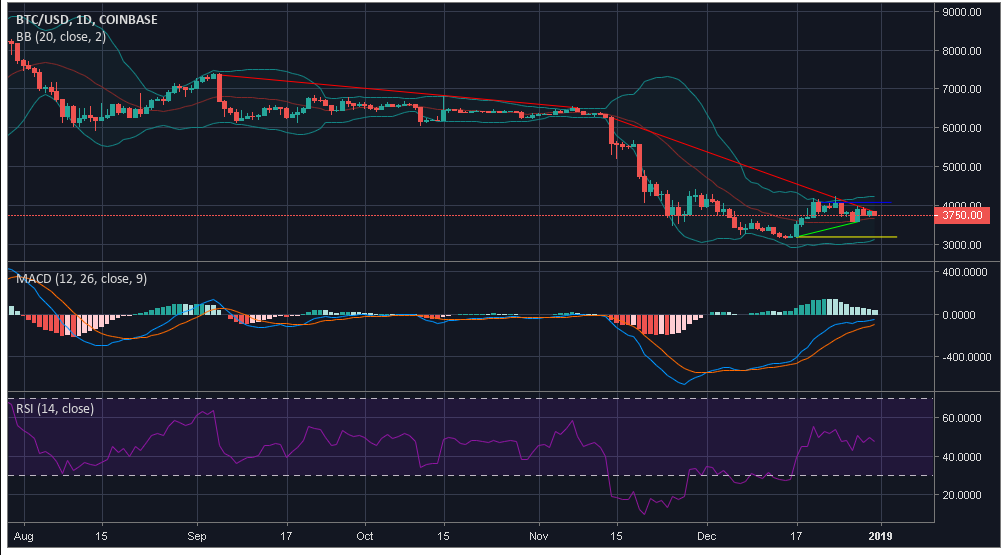
The one-day chart of the coin points towards a massive fall from $7359.99 to $6511.88, which further continues to $6259.35 to $3829. A miniscual uptrend was noticed from $3184.28 to $3576.12, with a resistance marked at $4075.33. BTC was offered support at $3184.28.

Bollinger Bands appears to be at a converging point, indicating a decreased volatility in the market. The moving average line is under the candlesticks, thus marking a bullish market.

MACD line is above the signal line hinting towards a bullish market.

Relative Strength Index indicates that the buying and selling pressures are evening each other out.

Conclusion

According to the indicators, Awesome Oscillator and Parabolic SAR a bearish market is predicted. However, Chaikin Money Flow, Bollinger Bands, and MACD point towards a bullish market.


Published 1 min ago on January 1, 2019 By Namrata Shukla

David Ogden – Http://markethive.com/david-ogden

Bitcoin – Bears in Control as the Year Comes to an End

Bitcoin – Bears in Control as the Year Comes to an End

Bitcoin – Bears in Control as the Year Comes to an End

It’s back in the red for Bitcoin and how the year ends could be a signal of just what’s to come through the early part of New Year.

Bitcoin gained 2.14% on Sunday, partially reversing a 3.54% fall on Saturday, to end the day at $3,977.3.

A bullish start to the week failed to deliver another cryptomarket rally off the back of the previous week’s 23.4% gain, with Bitcoin ending the week down 2.34% and of greater significance, back at sub-$4,000 levels.

Following a late in the day sell-off on Saturday, Bitcoin fell to a start of a day intraday low $3,838.9, holding above the day’s first major support level at $3,802.3 before finding support.

There were no fireworks through the day, with Bitcoin only managing a move through to a mid-day intraday high $4,003.8 before easing back, with sub-$3,900 support holding Bitcoin back from a slide back to $3,800 levels.

The moves through the day saw Bitcoin come within range of the first major resistance level at $4,042.70 and the first major support level at $3,802.3.

For the Bitcoin bulls a run at $5,000 levels was needed before the year was out to shift the negative sentiment that has plagued Bitcoin and the broader market since the return of crypto volatility in late October.

Failing to hold onto $4,000 levels in the week will continue to raise doubts over whether Bitcoin has bottomed out or is about to get hit by another sell-off that would deliver the widely predicted sub-$3,000 floor.

The bearish sentiment has seen Ethereum close the market cap gap on Ripple’s XRP, with Ethereum looking ripe to retake the 2nd spot, though much will depend on the Token Taxonomy Act, a recovery in the ICO market only a good thing for Ethereum that has struggled over the year.

At the time of writing, Bitcoin was down 1.75% to $3,907.9, with moves through the early morning seeing Bitcoin slide from a start of a day morning high $3,986.9 to an early morning low $3,873.4, Bitcoin calling on support at the first major support level at $3,876.2, whilst falling short of $4,000 levels and the first major resistance level at $4,041.1.

For the day ahead, a hold onto $3,900 levels through the morning would support a move through the morning high to bring $4,000 levels and the first major resistance level at $4,041.1 into play, with sentiment across the broader market to play a hand in how Bitcoin closes out the day.

Early moves and a failure at the start of the day for Bitcoin to break through to $4,000 levels will likely weigh through the morning.

Failure to hold onto $3,900 levels through the morning could see Bitcoin slide back through the morning low $3,873.4 to bring $3,700 levels and the second major support level at $3,775.1 into play before any recovery.

The way the year is coming to a close, it could be a tough start to 2019 and if there’s no good news from regulators, it may be more than just a tough January.

Bob Mason

FXEmpire 57 minutes ago

David Ogden – Http://markethive.com/david-ogden

Bitcoin Price Weekly Analysis -BTC Holding Key Uptrend Support

Bitcoin Price Weekly Analysis -BTC Holding Key Uptrend Support

Bitcoin Price Weekly Analysis -BTC Holding Key Uptrend Support

Key Points

  • Bitcoin price declined recently towards the $3,560 support area against the US Dollar.

  • There is a key bullish trend line formed with support $3,680 on the 4-hours chart of the BTC/USD pair (data feed from Kraken).

  • The pair is currently holding a crucial support and it could bounce back above $3,800 and $3,900.

Bitcoin price is holding the key uptrend support near $3,600 against the US Dollar. BTC/USD is likely to resume its upward move above $4,000 in the near term.

Bitcoin Price Analysis

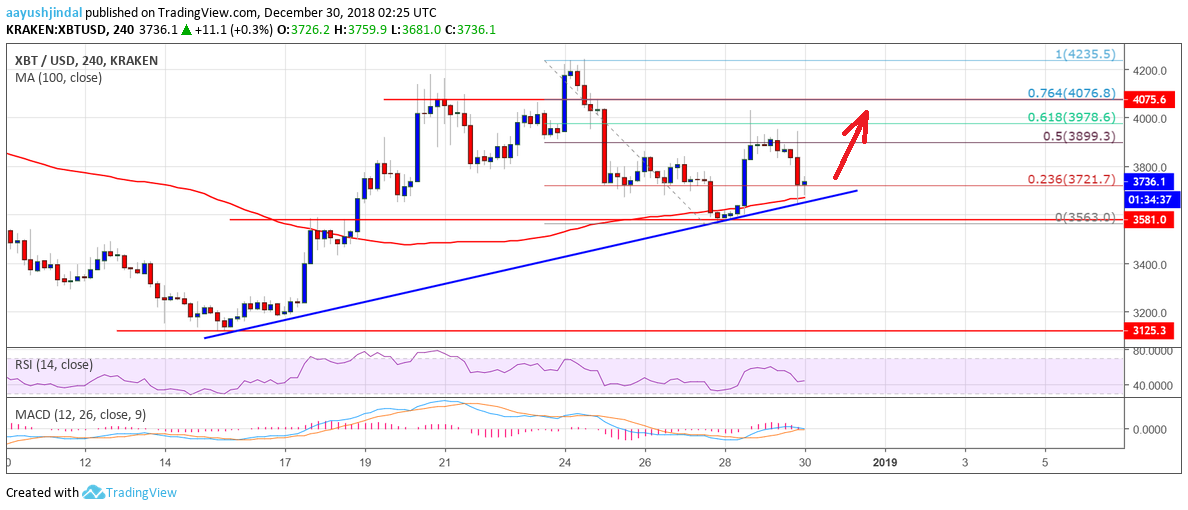
This past week, bitcoin price started a major downside move from the $4,235 level against the US Dollar. The BTC/USD pair traded below the $4,000 and $3,800 support levels. However, the price found support near the $3,550 level and later started an upward move. More importantly, the price stayed above the $3,500 pivot level and the 100 simple moving average (4-hours).

The price jumped above $3,800 and the 50% Fib retracement level of the recent decline from the $4,235 high to $3,563 low. However, the price failed to clear the $3,980 and $4,000 resistance area. Besides, the 61.8% Fib retracement level of the recent decline from the $4,235 high to $3,563 low also acted as a resistance. There was yet another downside move, but the $3,675 level acted as a support. Finally, there is a key bullish trend line formed with support $3,680 on the 4-hours chart of the BTC/USD pair. If there is a break below the trend line, the price decline towards $3,550 or $3,500.

Looking at the chart, BTC price seems to trading above important support levels near $3,600. On the upside, buyers need to clear the $3,900 and $4,000 resistance levels for more gains. The next major resistance is near the $4,080 and $4,200 levels.

Looking at the technical indicators:

4-hours MACD – The MACD for BTC/USD is likely to move back into the bearish zone.

4-hours RSI (Relative Strength Index) – The RSI is currently below the 50 level.

Major Support Level – $3,550

Major Resistance Level – $4,000


AAYUSH JINDAL | DECEMBER 30, 2018 | 5:00 AM

David Ogden – Http://markethive.com/david-ogden

Bitcoin Breakouayt that didn’t happen – sidews days in the year ahead

Bitcoin Breakout that didn't happen - sideways days in the year ahead

Bitcoin Breakout that didn't happen – sideways days in the year ahead

  • BTC broke out of Cup and Handle pattern, but gave up.

  • Consolidation is the way ahead in the new year.

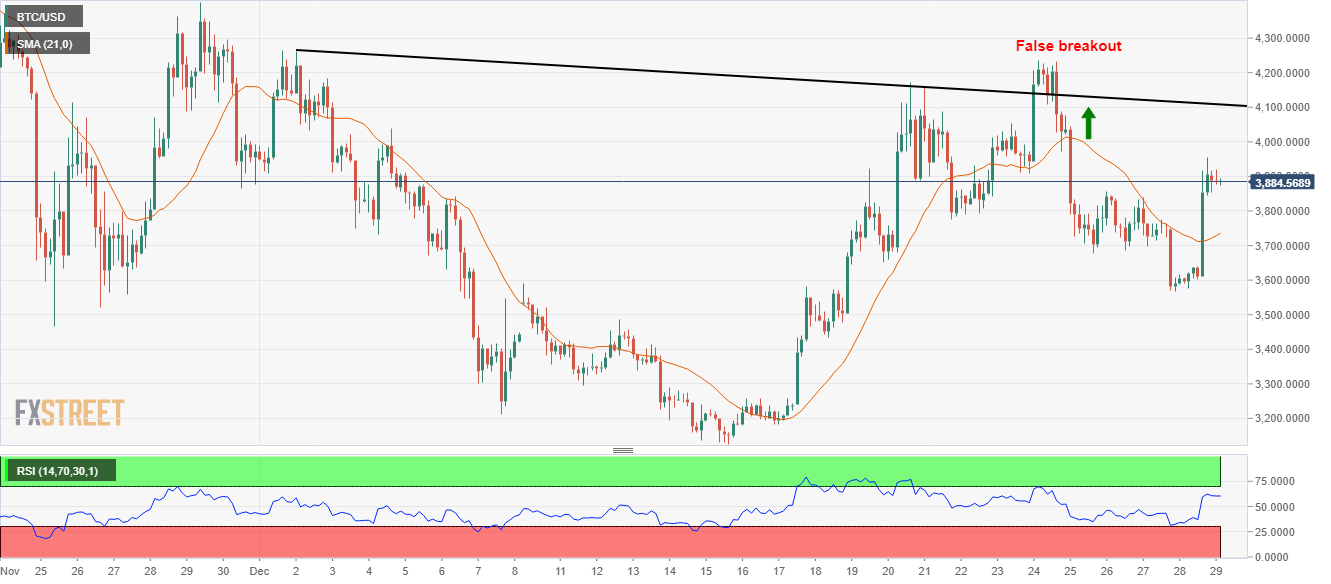
Bitcoin, the poster boy of cryptocurrency world, did break out of the cup and handle pattern on the charts, as pointed by this author last week, but only to give up again, in a sign that bulls too are on Christmas vacation alongwith bears.

BTC/USD is down about two cents of a percent at $3,881 and trading in less than 2 percent range for the day in a thinly traded weekend as well as year-end trading. On the 180-minute chart, this largest crypto by market cap, did break out of the cup and handle pattern by crossing past $4,200 resistance line, but couldn't sustain it. Resulting into prices going below the very trendline they broke out of.

Although, after the claw back, prices found support at 21 days SMA around $3,576, while upside still seems capped around $4,200, signalling consolidation ahead as the new year dawns.

BTC/USD 180-minute chart:


Manoj B Rawal

FXStreet

David Ogden – Http://markethive.com/david-ogden