Bitcoin (BTC) Long Term Price Forecast- January 5
BTC/USD Long-term Trend: Bearish
Resistance levels: $7,200, $7,300, $7,400
Support levels: $3,800, $3,700, $3,600
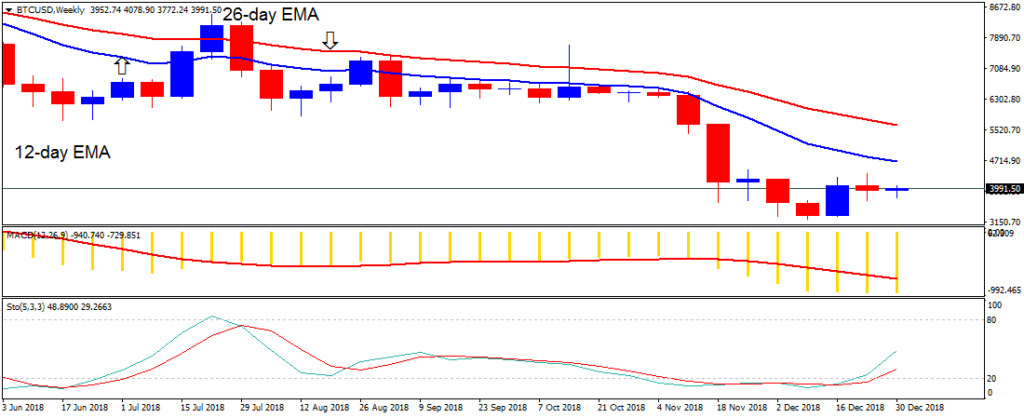
The BTCUSD pair had been ranging in the last ten days. In the short time frame, Bitcoin was ranging at the $3,900 price level. The crypto’s price also faces resistance at the $4,000 price level. However, the BTC price has an opening balance of $3,862.60 in the month of January . From the weekly chart, the price of Bitcoin is in the bearish trend zone.

In other words, the crypto’s price is below the 12-day EMA and the 26-day EMA which indicates that Bitcoin is likely to fall. Meanwhile, the MACD line and the signal line are below the zero line which indicates a sell signal.
In addition, the stochastic is in the oversold region but above the 20% range. This indicates that the price of Bitcoin is in a bullish momentum and a buy signal. In the meantime, the blue band of the stochastic is above the red band indicating the reversal of the previous trend.
By Azeez M – January 5, 2019
David Ogden – Http://markethive.com/david-ogden