Bitcoin Price Analysis – Are We Heading for a Breakout or a Fadeout?
I want to have a closer look at bitcoin technical analysis and the levels that are important to keep an eye on over the next few weeks.
Bitcoin is up 45% since I posted an article back in February about how I think the tide is turning.

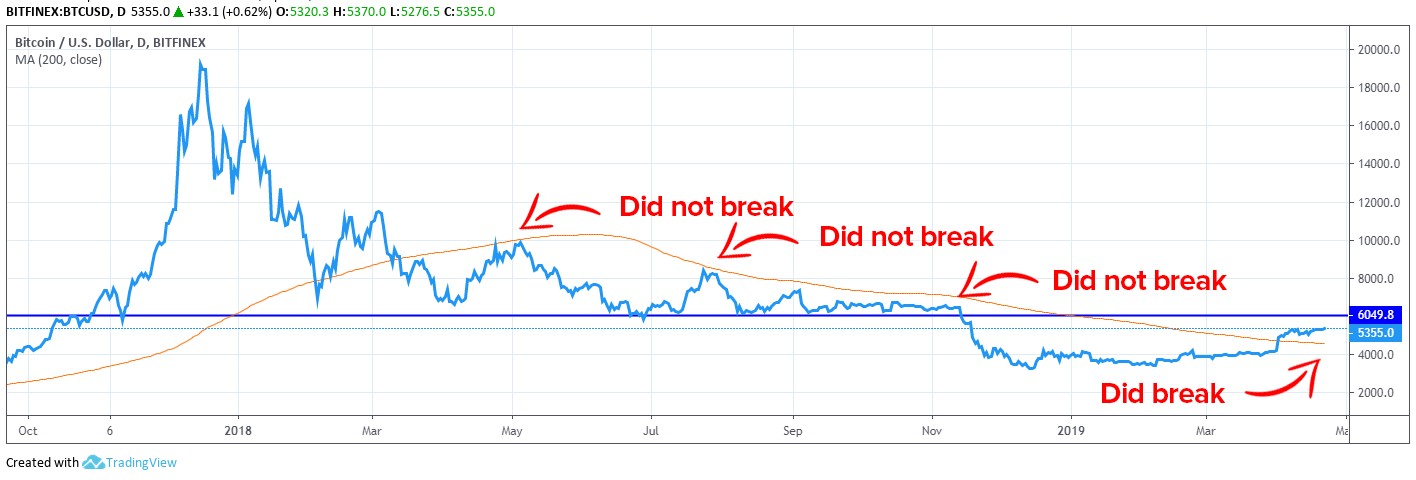
Prices have been mirroring the 200-day moving average shown in red in the chart above. Previously, we can see that bitcoin got close to the 200-day moving average, but failed to break through and then fading back down.
As we can see now bitcoin has now rallied past the 200-day moving average for the first time in a long time.
Bitcoin now has resistance at the $5300 level, where it has roughly been since the earlier this month, but rather than fading as it did in the past, it is holding in a tight range.
This shows the action is bullish and is likely going to have its next move be another push higher. The next resistance level is up just north of $6000.
So, is this a sign of a breakout coming or will bitcoin once again fail to climb the ladder?
As long as bitcoin holds above the line (currently about $5,100), then the odds are in favor a shaper move higher over the coming weeks.
The chances of bitcoin making a break higher up to the $6000+ level is significant, but for those who want to protect themselves, putting in a stop order at $5000 will allow them to capitalize on the probable upward move while applying protection in case the position breaks down.
To see how I have been able to uncover bitcoin prices swings correctly over the last several years join my next presentation where I outline my favorite cryptocurrency trading strategy and what I look for to give myself the best opportunity to profit. Click here to learn more.
Disclaimer: This is not trading or investment advice. The above article is for entertainment and education purposes only. Please do your own research before purchasing or investing into any cryptocurrency.
By cdouthit – April 26, 2019
David Ogden – Http://markethive.com/david-ogden