Bitcoin (BTC) Price Still In Strong Uptrend, Buying Dips Favoured
-
Bitcoin price traded to a new monthly high at $4,064 and later corrected lower against the US Dollar.
-
The price declined sharply below $3,950, but dips remained supported above $3,900.
-
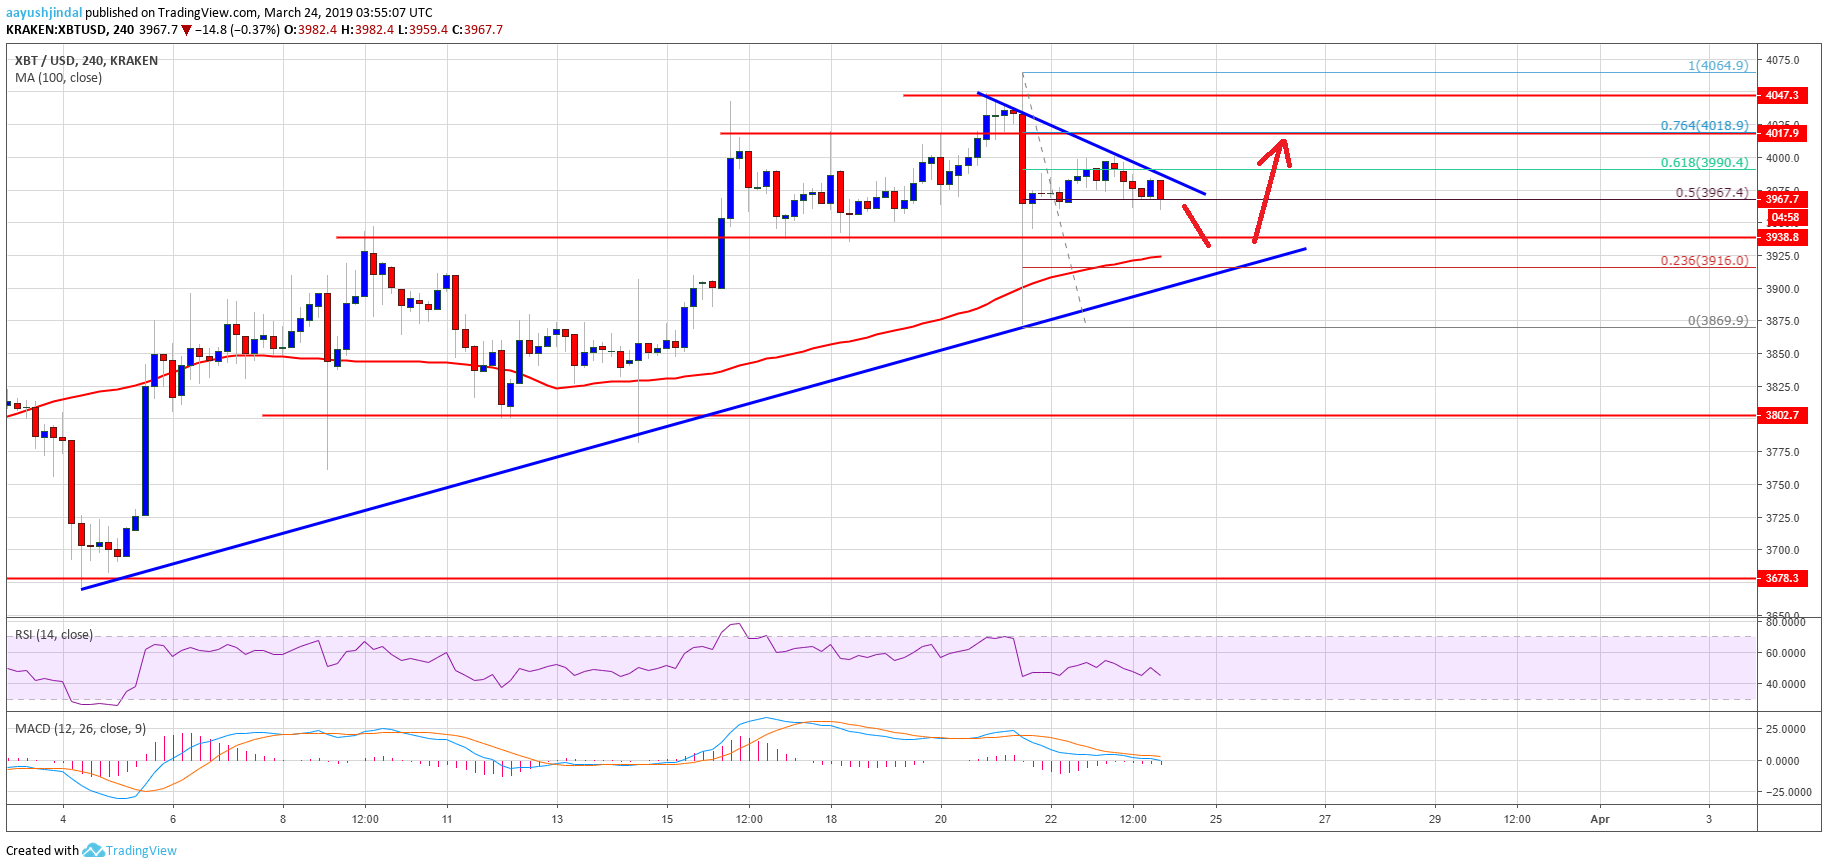
There is a crucial bullish trend line formed with support at $3,920 on the 4-hours chart of the BTC/USD pair (data feed from Kraken).
The pair remains well supported on dips near the $3,920 level and the 100 simple moving average (4-hours).
Bitcoin price is still in a strong uptrend despite recent bearish moves against the US Dollar. BTC/USD is likely to find a solid buying interest if it dips towards $3,940 or $3,920.
Bitcoin Price Weekly Analysis (BTC)
This past week, there was a decent upward move above $4,000 in bitcoin price against the US Dollar. The BTC/USD pair traded in a range above the $3,940 support level and finally broke the $4,000 resistance level. Buyers pushed the price above the $4,020 resistance and a new monthly high was formed at $4,064. However, buyers failed to hold gains above $4,020, resulting in a sharp decline below $4,000. The price dropped heavily and broke the $3,960 and $3,940 support levels.
There was even a spike below the $3,900 support and the 100 simple moving average (4-hours). Having said that, buyers defended the $3,900 support and the price bounced back sharply above $3,940. There was a break above the 50% Fib retracement level of the last decline from the $4,064 high to $3,869 low. The recent recovery was solid, but the price faced a strong offer zone near the $4,000 resistance. The 61.8% Fib retracement level of the last decline from the $4,064 high to $3,869 low also acted as a hurdle.
At the moment, the price is consolidating below the $4,000 resistance. Besides, there is a short term connecting bearish trend line in place with resistance at $3,990 on the 4-hours chart of the BTC/USD pair. A clear break above the trend line and $4,000 could open the doors for a fresh upward move. On the downside, there are many supports near the $3,940 and $3,920 levels. There is also a crucial bullish trend line forming with support at $3,920 on the same chart.

Looking at the chart, BTC price is clearly well supported on the downside near the $3,940 and $3.920 levels. As long as the price is above the $3,900 support and the 100 SMA, there are chances of a steady rise in the coming sessions. Buyers may wait for a clear break above the $4,000 and $4,020 resistance levels to gain control.
Technical indicators
4 hours MACD – The MACD for BTC/USD is slightly placed in the bearish zone.
4 hours RSI (Relative Strength Index) – The RSI for BTC/USD is currently well below the 50 level.
Major Support Level – $3,900
Major Resistance Level – $4,020
AAYUSH JINDAL | MARCH 24, 2019 | 5:00 AM
David Ogden – Http://markethive.com/david-ogden