Bitcoin (BTC) Price Watch- Hovering at Make-or-Break Levels

Bitcoin (BTC) Price Watch- Hovering at Make-or-Break Levels

Bitcoin (BTC) Price Watch- Hovering at Make-or-Break Levels


Bitcoin Price Key Highlights
 

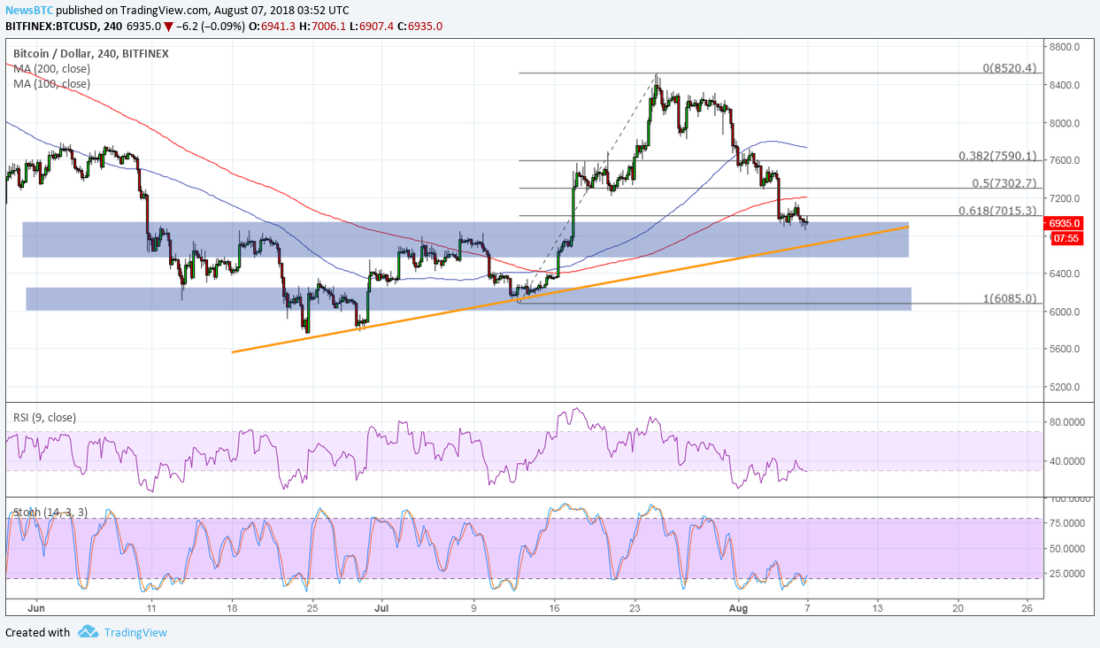
  • Bitcoin price is still in correction territory as it hangs around the area of interest around $6,800 to $7,000.

  • Several inflection points are in confluence on this area, and a bounce could allow the uptrend to resume.

  • However, a break below this key level could mean a continuation of the longer-term selloff.

Bitcoin price continues to test the area of interest where bulls are expected to join in and confirm that it has bottomed out.
 

Technical Indicators Signals

The 100 SMA is above the longer-term 200 SMA still, indicating that the path of least resistance is to the upside. In other words, there’s still a strong chance for the uptrend to resume. However, the gap appears ready to narrow, possibly indicating slower bullish momentum.
 

Price is also starting to break below the 61.8% Fibonacci retracement level and the $7,000 major psychological mark, which means that bullish energy at that area still isn’t strong enough to let the climb resume. The line in the sand might be the rising trend line connecting the lows since July as a break below this could expose bitcoin price to a drop to the floor at $5,800.


RSI is slowly making its way up after spending some time in the oversold region. This suggests that sellers are taking a break but buyers are also struggling to get back on their feet. Similarly stochastic is making another attempt to pull out of the oversold region to signal that buyers are taking over.

here have been reports confirming that Goldman Sachs is taking a stake on the cryptocurrency industry, reviving hopes of stronger institutional interest. Recall that updates like these have propped up bitcoin price in the past weeks, but it seems that traders aren’t reacting as much to the latest news.
 

Still, it’s worth noting that Bloomberg reported on how Goldman Sachs is considering a plan to offer custody for crypto funds, which would involve holding securities tied to these assets in order to reduce client risk and guard themselves from potential security attacks on exchanges.


SARAH JENN | AUGUST 7, 2018 | 4:16 AM

David Ogden – Http://markethive.com/david-ogden

Don’t Expect New Bitcoin Highs in 2018

Don't Expect New Bitcoin Highs in 2018

Don't Expect New Bitcoin Highs in 2018

Many investors and advisors are on record stating that $5,700 was the bottom in bitcoin for this year, and that higher prices lie ahead. While we are very bullish on bitcoin's long-term prospects, we do heed caution for more short-term price optimism.

To find the starting point of the historic parabolic rally in bitcoin that ended at $20,000 we have to go as far back as August 2015, when bitcoin traded at below $200. This past rally was a stupendous, historic move. Even in secular bull markets, the collective of economic actors need time to absorb the information embedded in its characteristic high volume rallies.

As I've indicated in my 2018 outlook, I think chances are high for this year to be remembered as a shakeout year: a lemon market in altcoins, regulators catching up and infrastructure growing pains.
 

Short-term bearish signs

Since January, the bitcoin mining hashrate (aggregate computations per second made to secure the network ) has tripled, which means that a huge amount of new or more efficient mining rigs have come online. In combination with declining prices, this means that miners who weren't able to upgrade their machines or find cheaper electricity have been faced with a steep decline in profitability, a 90% drop in 7 months (altcoins have faced similar or steeper declines).

With profit margins under heavy pressure, it's not unlikely that miners are and will stay responsible for a significant amount of selling in the market.

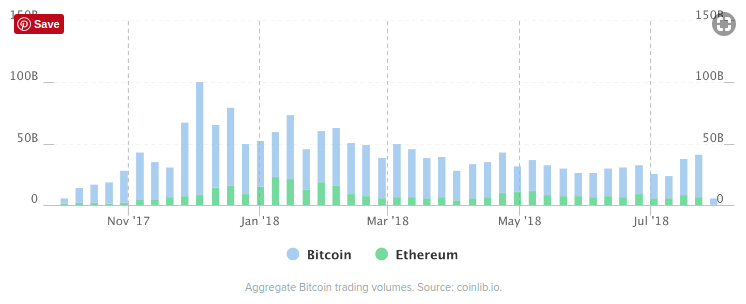
Next, trading volumes are not dead, but still below those seen during last winter and spring.

It's unclear how much of the recent pick-up in volumes are the result of a short squeeze and how much is coming from new long-term buyers coming in.
After last year's FOMO, retail interest in bitcoin has now become very sluggish:

A Gallup poll conducted three months ago suggested that less than 0.5% of U.S. investors "will probably buy bitcoin in the near future."

Despite transaction fees and volatility having dropped strongly, merchants are seeing +50% lower bitcoin revenues compared to last fall.

Google searches are not suggestive of a quick retail fueled recovery either:
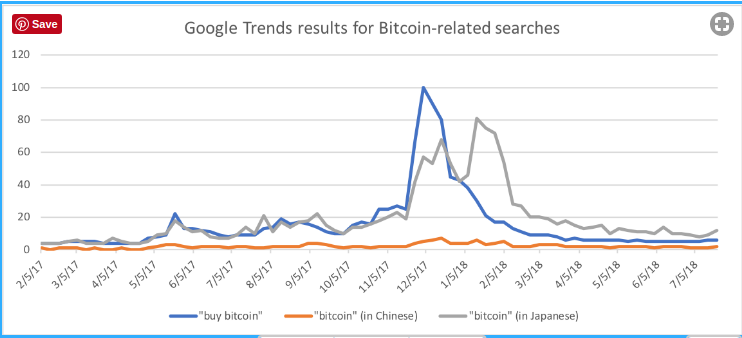
Next, here are some comments we've gathered from bitcoin analysts, market makers and Wall Street insiders:
 

The first bitcoin ETF will likely not be approved before 2019. So any anticipation of approval by September will likely be met with disappointment.

While institutional investors are certainly getting involved in bitcoin, the vast majority of the firms are trading firms who are looking to make markets regardless of price: they're just as happy to take on short positions as they are to go long. Institutions who are known to be long-biased, such as mutual funds and pension funds are not ready to invest because they're not yet comfortable with the available custody solutions.

There's also the NVM Ratio, which is designed to reflect early stage adoption, now suggesting that there's now too little on-chain activity to justify bitcoin's current market cap:
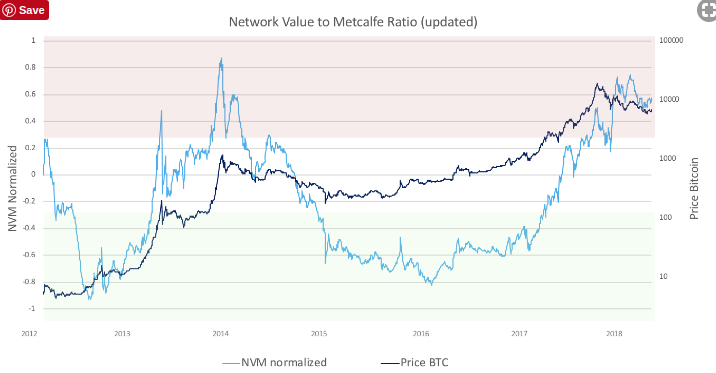
The assumption here is that bitcoin's market value is mostly derived from it being a network that connects users around the world: the more people and entities use the bitcoin blockchain to settle transactions, the more it acquires the liquidity and utility that we'd expect from digital gold.

The NVM ratio approximates that by measuring daily active addresses on the blockchain. Similar valuation models have been made for growth companies such as Facebook and Linkedin, where the number of monthly active users reasonably correlates with enterprise value.

(There are several objections one could raise against the NVM Ratio: it doesn't take into account transaction amounts nor the difference between old an new addresses, it doesn't discount spam attacks, it doesn't acknowledge limitations to the block size and neither does it consider institutions coming into the market who build derivatives on bitcoin that rely on a small amount of high-value cold storage addresses. More work is needed to refine valuation models. That said, even though bitcoin's core value proposition is as a store of value, we do think we're still in the early adoption phase, and hence using a valuation metric that reflects this adoption makes sense to us. In that context, we think the NVM's on-chain activity based valuation method has merit.)

The related NVT ratio, which tries to measure if the daily dollar value of all bitcoin transactions is relatively high or low versus the market cap, also suggests overvaluation.

Finally, in the past few months, we've also seen a number of macro events that would appear to be bullish for bitcoin as a safe haven: the North Korea debacle, a spike in volatility, Chinese stocks breaking down, etc. However, these shocks didn't move the meter for bitcoin.


Some caveats

All this being said, lower bitcoin prices ahead are not a foregone conclusion:

  • The bitcoin price has already come down by 62 percent since December.

  • Since March, the Chinese Yuan has dropped by 8 percent against the dollar. If this slide continues, Chinese capital could flee into bitcoin.

  • Bitcoin dominance is gaining ground, which we think indicates the market's slow realization that there's a large moat around the bitcoin ecosystem now which will make it hard to dislodge.

  • The 2015–'17 rally was historic but not entirely unique for this ecosystem: between late 2011 and April 2013, the bitcoin price multiplied by 100x, and, after a six-month correction, it multiplied again by 10x.

  • Value investors are already anticipating the May 2020 block reward halving, which will cut down bitcoin's annual supply inflation from 3.7 percent to only 1.79 percent.

  • A bitcoin ETF approval, even if it's delayed, would be a huge deal because it makes the asset extremely accessible for the retail investor. After the first gold ETF went live in 2004, the gold price rallied by 350 percent (and it's still 200 percent higher today). The 2017 rally has also set in motion a flurry of corporate activity on the bitcoin infrastructure side, and the promise of established banks, brokers, payment processors, and security providers offering their own solution suites is catching the attention of value investors.

Conclusion

We think the market likely needs more time to absorb the recent 30-month rally, which could produce lower prices.

We don't foresee new all-time highs in bitcoin for 2018, and unless data starts suggesting differently, we are expecting mostly sideways or lower price action.

Author Tuur Demeester

Updated Aug 6, 2018 at 02:03 UTC

David Ogden – Http://markethive.com/david-ogden
Bitcoin Price Weekly Analysis – BTC/USD Remains Sell on Rallies

Bitcoin Price Weekly Analysis - BTC/USD Remains Sell on Rallies

Bitcoin Price Weekly Analysis – BTC/USD Remains Sell on Rallies


Key Points

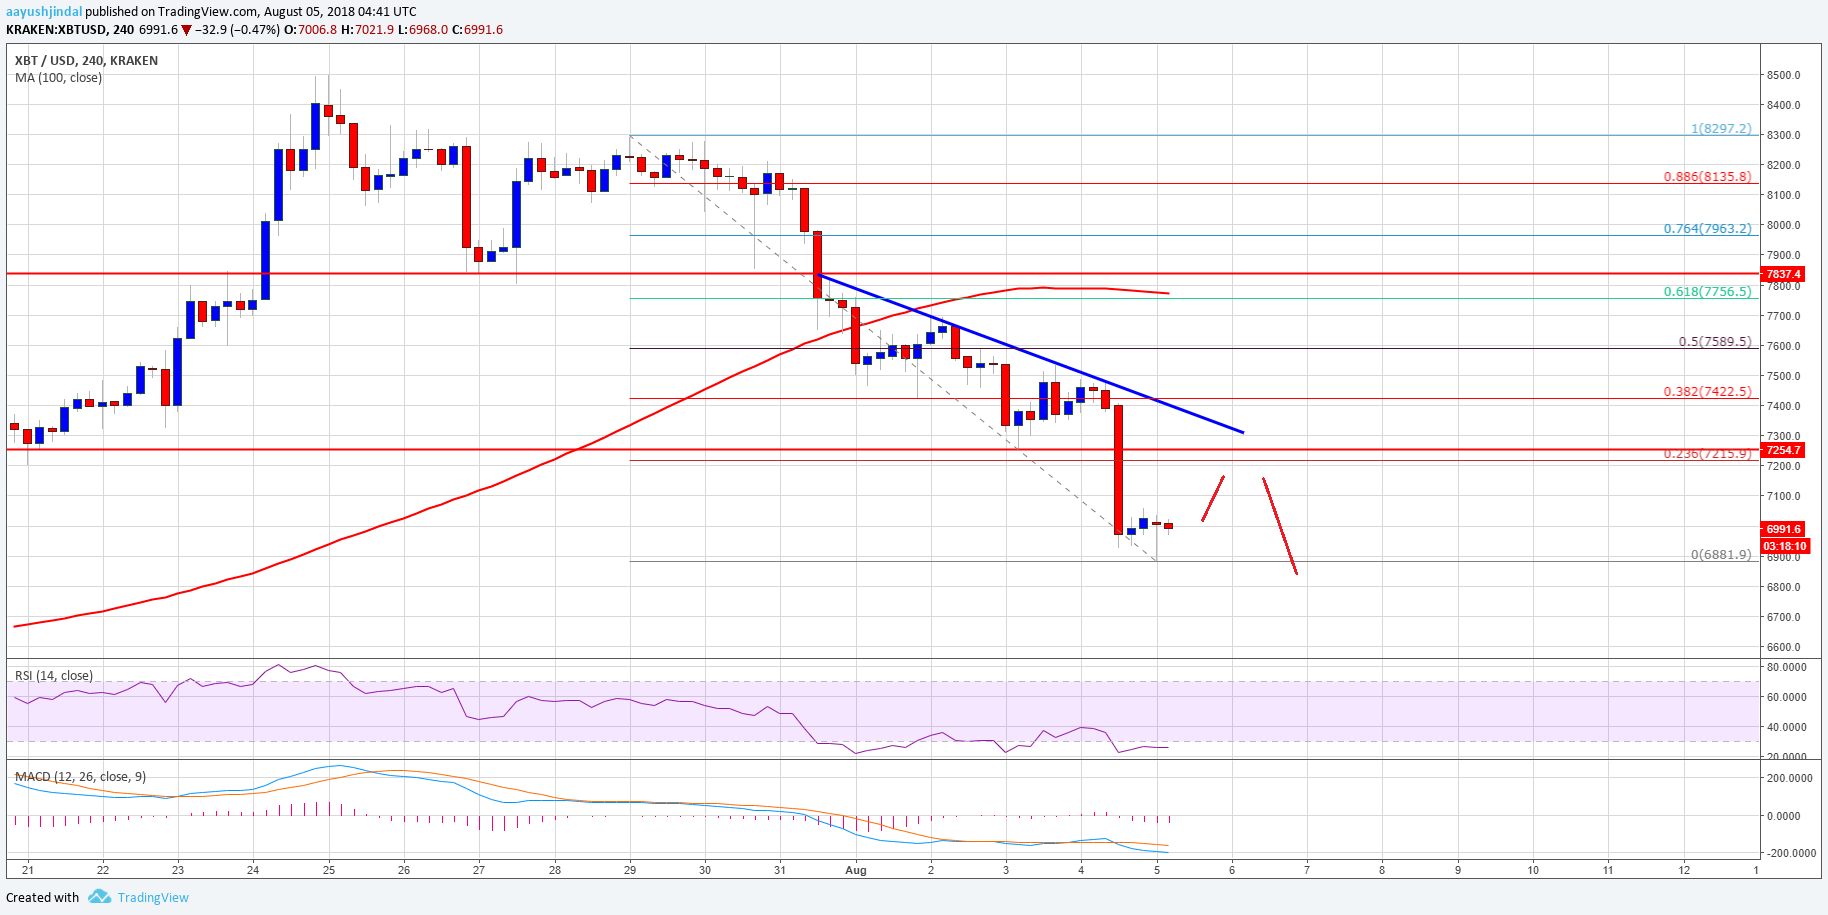
  • Bitcoin price declined below $7,260 and moved into a bearish zone against the US Dollar.

  • There is a major bearish trend line formed with resistance at $7,320 on the 4-hours chart of the BTC/USD pair (data feed from Kraken).

  • The pair must clear the $7,260 and $7,320 resistances to move back in a positive zone.

Bitcoin price tuned bearish with a close below $7,260 against the US Dollar. BTC/USD’s upsides remain capped near the $7,260 and $7,320 levels in the near term.


Bitcoin Price Upside Hurdles

This past week, there was a sharp downside move from well above $7,600 in bitcoin price against the US Dollar. The BTC/USD pair declined and broke the $7,500 and $7,260 support levels to move into a bearish zone. It even traded below the $7,000 level and is currently well below the 100 simple moving average (4-hours). A new monthly low was formed at $6,881 and the price is currently consolidating.


An initial resistance on the upside is near the 23.6% Fib retracement level of the last dip from the $8,297 high to $6,881 low. More importantly, there is a major bearish trend line formed with resistance at $7,320 on the 4-hours chart of the BTC/USD pair. Below the trend line resistance, the previous support at $7,260 is a crucial resistance. Therefore, the $7,260 and $7,320 resistances are major barriers for more gains in BTC in the near term. Should there be a break above $7,320, the price could recover. The next resistance awaits near $7,600 and the 50% Fib retracement level of the last dip from the $8,297 high to $6,881 low.

Looking at the chart, BTC price is clearly trading in a bearish zone below $7,260. If it fails to recover and slides below $6,880, the next stop for sellers could be $6,500-6,600.


Looking at the technical indicators:


4-hours MACD – The MACD for BTC/USD is mostly placed in the bearish zone.

4-hours RSI (Relative Strength Index) – The RSI is currently well below the 30 level.

Major Support Level – $6,880

Major Resistance Level – $7,320


AAYUSH JINDAL | AUGUST 5, 2018 | 6:30 AM

David Ogden – Http://markethive.com/david-ogden
NYSE parent launches digital currency exchange

NYSE parent launches digital currency exchange

NYSE parent launches digital currency exchange


Bitcoin is coming to the Big Board — sort of.

The parent company of the New York Stock Exchange is pushing for digital currencies to reach the investing mainstream through a new marketplace backed by some of Wall Street’s biggest investors.

The InterContinental Exchange said Friday it had formed Bakkt, a new exchange-like company for investors to trade bitcoin and other digital assets.

The company, led by Kelly Loeffler, the wife of ICE Chief Executive Jeff Sprecher, plans to start trading bitcoin futures in November via its app, it said.

Bakkt has partnered with Starbucks, which hopes the seamless bitcoin app will easily convert the digital asset to dollars — that can be used to buy its products.

Like leaders of other cryptocurrency firms, Loeffler has a lofty goal for Bakkt — nothing less than replacing credit cards with her bitcoin app.

Bakkt’s investors are “expected” to include Microsoft’s venture capital arm, Fortress Investment Group, and Michael Novogratz’s Galaxy Digital.

Author Kevin Dugan

David Ogden – Http://markethive.com/david-ogden

Bitcoin (BTC) Price Analysis – Wedge Resistance Holding, Support Next?

Bitcoin (BTC) Price Analysis - Wedge Resistance Holding, Support Next

Bitcoin (BTC) Price Analysis – Wedge Resistance Holding, Support Next?

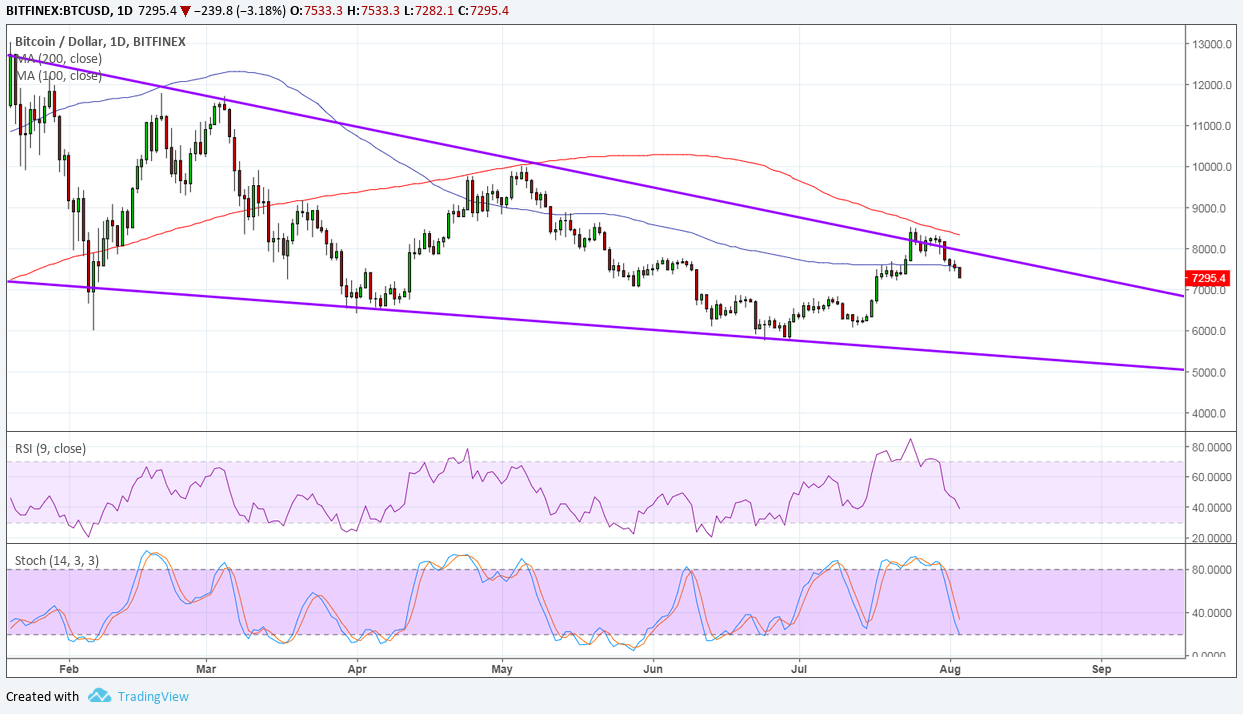
Bitcoin appears to be blocked at the top of its daily falling wedge formation.

Bitcoin has formed lower highs and lower lows to create a falling wedge pattern on its daily chart. Price is hitting a roadblock at resistance and might be due to test support once more.

The 100 SMA is still below the longer-term 200 SMA to indicate that the path of least resistance is to the downside. This means that the selloff is more likely to resume than to reverse. Price also came close to testing the 200 SMA dynamic resistance and is tumbling below the 100 SMA dynamic inflection point.

RSI is also heading south so bitcoin might follow suit while sellers remain in control. Stochastic is also heading lower to indicate the presence of selling pressure. Both oscillators have a bit more room to slide but are nearing oversold levels to signal potential exhaustion among sellers and a possible return in bullish pressure later on.

At the same time, the gap between the moving averages is starting to narrow to reflect slower bearish momentum. An upward crossover could bring buyers in and spark an upside break from the wedge resistance. This chart pattern spans $6,000 to around $12,000 so the resulting uptrend could be of the same height.

Bitcoin has had a rough ride in the past few days since it was bogged down by the HitBTC outage and negative remarks from Krugman. South Korea’s plans to tax cryptocurrency exchanges also weighed on prices. Still, some say that this also marks a much-needed pullback from consecutive weekly gains.

Institutional interest remains strong but probably not enough to make it to the headlines these days. Having the spotlight turn back to these kinds of updates could bring more gains for bitcoin and its fellow cryptocurrencies as funds from institutions could bring more liquidity and stronger volumes, likely drawing retail traders to reopen long positions.


By Rachel Lee On Aug 3, 2018

David Ogden – Http://markethive.com/david-ogden

Bitcoin (BTC) Price Watch – Bulls Defending Correction Level

Bitcoin (BTC) Price Watch - Bulls Defending Correction Level

Bitcoin (BTC) Price Watch – Bulls Defending Correction Level

Bitcoin Price Key Highlights

  • Bitcoin price is still in correction mode but appears to be finding support at the nearest Fib.

  • A bounce from current levels could take it back up to the swing high and beyond.

  • A move lower, on the other hand, could indicate that a deeper pullback from the uptrend is in order.

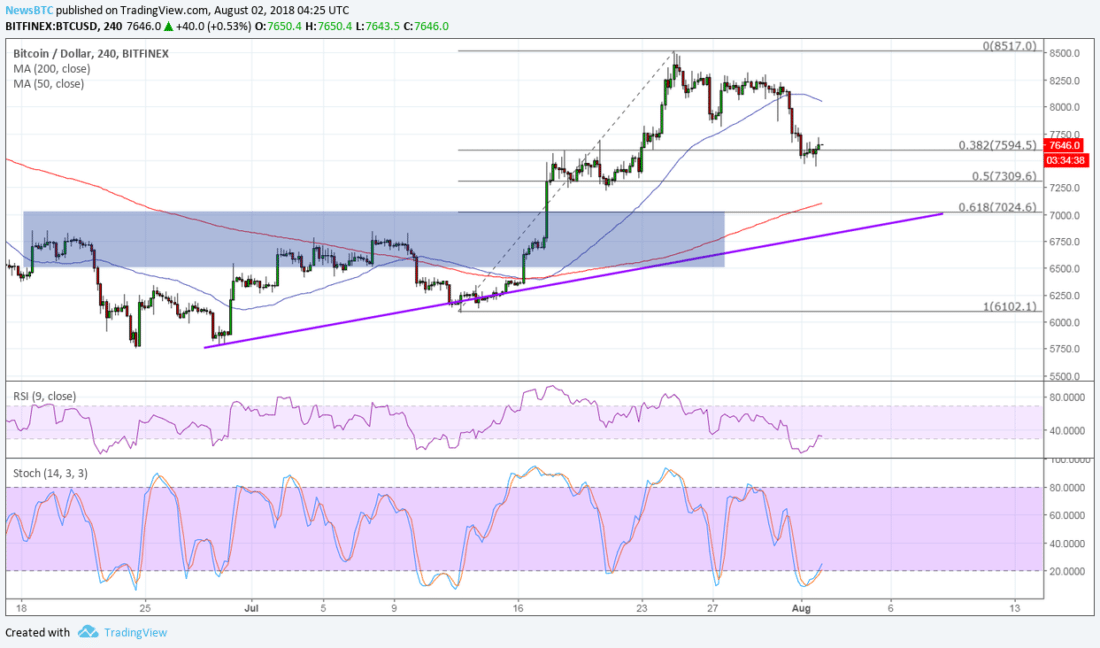
Bitcoin price has pulled back from its rally and could be due to resume the uptrend if the 38.2% Fib holds as support.


Technical Indicators Signals

The 100 SMA is still above the longer-term 200 SMA to signal that the path of least resistance is to the upside. This means that the uptrend is more likely to resume than to reverse. However, the 100 SMA appears to be turning from its climb and is narrowing the gap between the 200 SMA. This could be indicative of slowing bullish momentum.

For now, bitcoin price appears to be finding support at the 38.2% Fib but has yet to show more bullish traction on the bounce. A larger pullback may be in order, possibly until the rising trend line connecting the latest lows and the 200 SMA dynamic inflection point. This is also around an area of interest or former resistance at $6,800 to $7,000.

RSI is already indicating oversold conditions, though, or that sellers are tired and ready to let buyers take control. Stochastic is also pulling up from the oversold region to signal a return in bullish pressure.

Bitcoin price was weighed down by a number of factors earlier in the week, namely news of stricter regulation in South Korea, the outage on HitBTC, and Paul Krugman’s negative remarks on cryptocurrencies.

However, this might not be enough to derail the positive sentiment among most investors as it has been previously reported that institutional interest is picking up. Besides, the dollar could also be under pressure due to worsening trade tensions between the U.S. and China, so alternative assets like bitcoin could be poised to take advantage.


SARAH JENN | AUGUST 2, 2018 | 4:34 AM

David Ogden – Http://markethive.com/david-ogden

Bitcoin (BTC) Price Watch – Sharp Selloff on South Korea Update

Bitcoin (BTC) Price Watch -  Sharp Selloff on South Korea Update

Bitcoin (BTC) Price Watch – Sharp Selloff on South Korea Update

Bitcoin Price Key Highlights
 

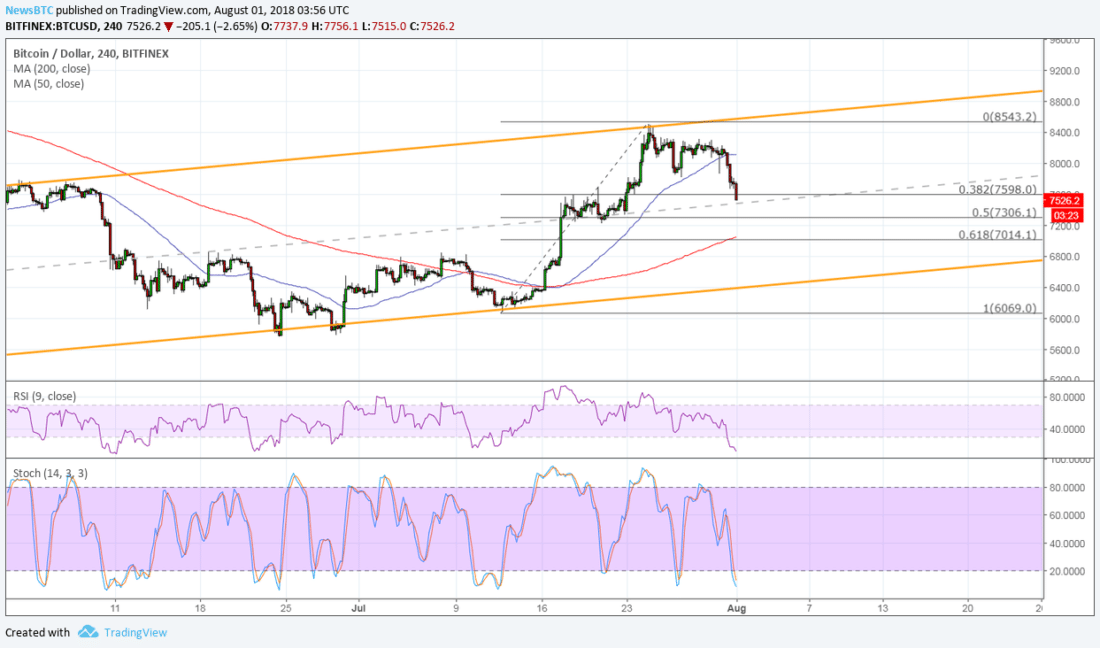
  • Bitcoin price broke below its short-term triangle consolidation and rising channel to pave the way for a larger pullback.

  • The Fibonacci retracement tool shows the potential support levels where buyers could be waiting.

  • Price might also be forming a larger ascending channel on its 4-hour time frame as indicators still support an uptrend.

Bitcoin price was unable to sustain the climb after previously consolidating, as a larger correction seems necessary.


Technical Indicators Signals

The 100 SMA is safely above the longer-term 200 SMA to indicate that the path of least resistance is to the upside. Although price already broke below the 100 SMA dynamic support to signal a pickup in bullish pressure, the gap between the moving averages is still wide enough to suggest that there’s no imminent threat of a bearish crossover.

Bitcoin price could move on to testing the 200 SMA dynamic inflection point next, and this lines up with the 61.8% Fibonacci retracement level at the $7,000 major psychological mark. A larger pullback could last until the very bottom of the freshly-forming ascending channel at $6,800, which lines up with a former resistance level.

RSI is heading lower to show that sellers are in control, but the oscillator is also dipping into oversold territory to signal exhaustion among sellers. Similarly stochastic is heading south so bitcoin price might follow suit, but it’s also approaching oversold levels to suggest a possible turnaround soon. In that case, the 38.2% Fib at the mid-channel area of interest might be enough to keep losses in check.

The recent slide is being pinned on news from South Korea as officials are looking into ending tax benefits for cryptocurrency exchanges. This has been prompted by rapidly increasing transaction volumes in the country, leading authorities to worry that a lot are being used for money-laundering and financing illegal activity.

Hong Seong-ki, head of the country’s cryptocurrency response team South Services Commission, said:

“While crypto markets have seen rapid growth, such trading platforms don’t seem to be well-enough prepared in terms of security. We’re trying to legislate the most urgent and important things first, aiming for money-laundering prevention and investor protection. The bill should be passed as soon as possible.”


SARAH JENN | AUGUST 1, 2018 | 4:12 AM

David Ogden – Http://markethive.com/david-ogden